The Inversion: When Assuring an AI Agent Costs More Than Running It
The Cost of Proof, Part I of VII · Architecture of Proof
Series Architecture: The Cost of Proof
Observability records what an agent did. Verification checks whether the result met defined criteria. Assurance assembles evidence that supports a defensible conclusion about the decision. This series examines what it costs to establish that confidence, and how product decisions change that cost.
- Part I (This Monograph): The Inversion: When Assuring an AI Agent Costs More Than Running It.
- Part II (Upcoming): Autonomy Is a Cost Multiplier: How Ordinary PRD Choices Multiply Telemetry Footprints.
- Part III (Upcoming): Unit Economics With Proof Included: The Fully Loaded Cost per Verified Outcome.
- Part IV (Upcoming): Tiered Proof: Matching Evidence Depth to Blast Radius and Reversibility.
- Part V (Upcoming): Who Owns the Bill?: Bridging the Product, FinOps, and SRE Divide.
- Part VI (Upcoming): Proof as Product: Monetizing Auditability, Replayability, and Verifiable Autonomy.
- Part VII (Upcoming): The 90-Day Playbook: Operationalizing the Proof Layer.
What This Means for Your Roadmap
- Set verification depth by consequence, not by step count. An agent that makes three irreversible decisions needs stronger checks than one that makes 25 reversible ones.
- Put the human escalation rate in the PRD. In the illustrative example below, human review is 86% of total cost. Model and telemetry choices matter mostly through the escalations they cause.
- Track cost per verified outcome, not cost per token. A cheaper model can produce the more expensive product.
- Ask for the split. For your highest-volume agent, ask engineering and finance what was spent generating outputs and what was spent checking them.
A Compliance Agent That Costs Less to Run Than to Check
Take an illustrative deployment: a compliance-review agent that processes 50,000 documents a month. Generation costs \$900. Automated evaluation of every output costs \$970 before the team pays for tracing, storage, or human escalation.
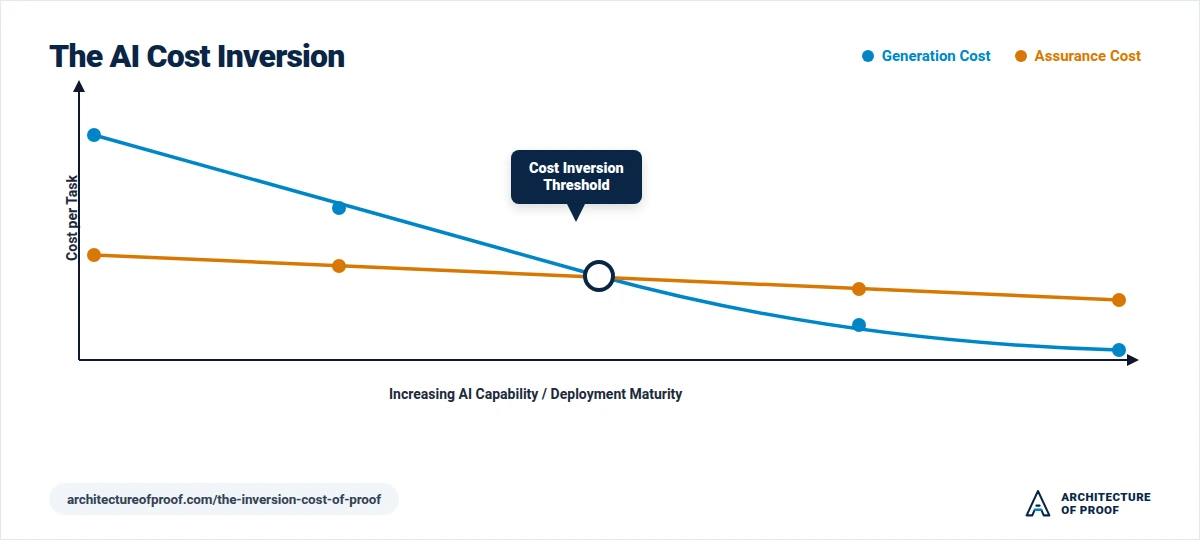
The shift is not that compute disappears. The cost of establishing confidence in an agent's work can exceed the cost of producing that work. For a product leader, that changes the unit of analysis from cost per model response to cost per accepted, policy-compliant outcome.
Enterprise surveys capture the initial friction as telemetry and trace storage budgets blow out, but this article extends that empirical signal to its root cause: the broader economics of assurance. The numbers below are author assumptions for a worked baseline, labeled as such. The survey evidence is self-reported and is described that way.
What Do Observability, Verification, and Assurance Each Establish?
Teams often use "observability" and "proof" as synonyms. They answer different questions.
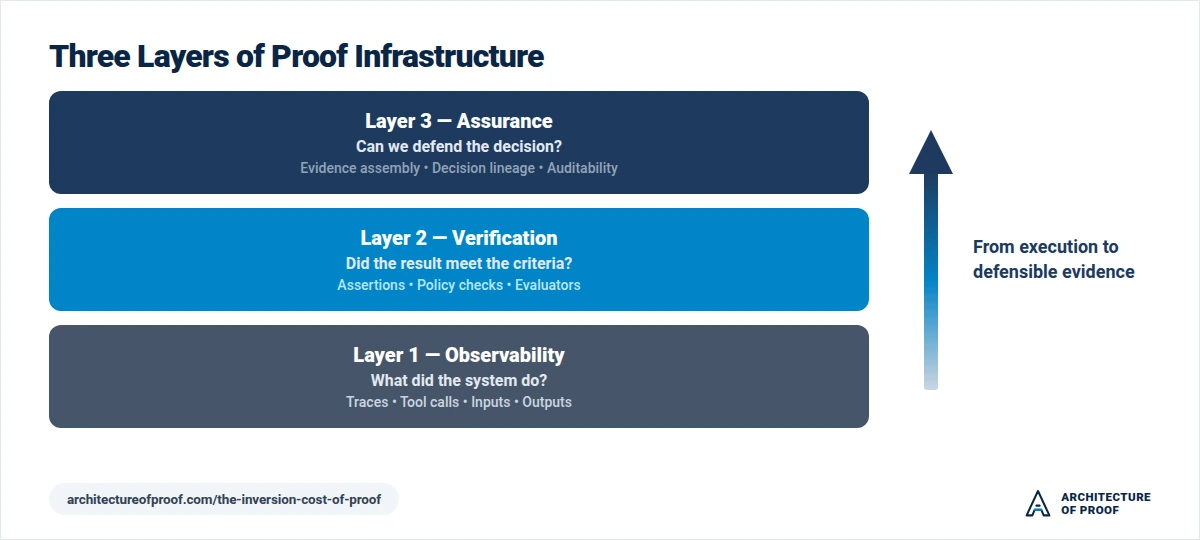
| Layer | What it establishes | What it does not establish |
|---|---|---|
| 1. Observability | What the system did: traces, tool calls, inputs, outputs, timing | Whether the action was correct |
| 2. Verification | Whether a result satisfies defined criteria: assertions, policy checks, evaluators, human review | Whether the criteria were complete |
| 3. Assurance | Whether the available evidence supports a defensible conclusion about the decision | Certainty in every circumstance |
A trace can show that an agent retrieved a policy document, called an approved API, and produced a decision. It cannot show that the policy was current, that the agent read it correctly, or that the downstream action was appropriate. An LLM judge that agrees with the agent is one more opinion, not independent confirmation.
This series uses proof infrastructure as the umbrella term for all three layers: the combined technical and organizational systems required to capture execution data, verify correctness, and assemble defensible evidence. Observability is the data-capture base. Verification and assurance are where most of the additional cost sits.
Why Can Assurance Cost More Than Generation?
Two cost curves move in different directions across the software stack.
Generation gets cheaper per unit of capability. The original 8K-context GPT-4 model launched in March 2023 at \$30 per million input tokens and \$60 per million output tokens. Distilled models, quantization, and prompt caching have since lowered the price of many tasks by an order of magnitude. Per-token prices across models are not directly comparable, because capability, token mix, and retry rates differ. The comparison that matters is cost per completed task.
Assurance does not inherit those discounts automatically. An agent that takes twelve reasoning turns may record the system prompt and retrieved chunks twelve times, and those payloads may be sent to several destinations. Model-based verification also adds an inference bill of its own. The loops that multiply tokens also multiply what you store and what you evaluate, and only one of those bills is falling.
One caution before the worked example. The Proof Ratio (the cost of proof infrastructure divided by generation inference spend) rises mechanically when inference gets cheaper, even if supervisory spend stays flat. A ratio above 1.0 therefore shows a change in cost mix. It does not show that the economics are getting worse. The commercial metric is introduced later in this article.
What Does the Industry Data Show, and How Much Weight Can It Bear?
Three tiers of evidence appear in this debate. They measure different things and should not be combined into a single claim.
1. Direct, Self-Reported Agentic Evidence
Apica commissioned an Omdia research study published on June 3, 2026, surveying 300+ enterprise IT decision-makers across North America and Western Europe:
- The release states that observability costs exceed direct compute in 69% of agentic AI projects (though some secondary coverage describes this as a share of enterprises).
- 59% reported having terminated or delayed an agentic AI deployment because of monitoring and observability expenses.
- Respondents expect an average 9.5x increase in telemetry volume over two years, with 44% expecting between 6x and 100x.
- The release reports that cybersecurity, legal and compliance, and fraud detection top the list of paused use cases (though the release does not publish exact percentage shares by category).
Apica sells telemetry pipeline software. These are survey responses from executives measuring budget friction, not audited general ledgers.
2. Adjacent Evidence About Observability in General
Broader surveys point the same way but cover IT and engineering populations, not agent builders. Splunk (with Oxford Economics) reports 57% of respondents say observability costs have exceeded the infrastructure they monitor. groundcover reports 49% attribute 26% to 50% of observability cost to AI workloads, which are not necessarily agentic. The ledger at the end lists each source and its caveats.
3. Architectural Contrast: Internal Cascade Monitoring vs. Black-Box Judges
Software architect Omid Saffari relayed an estimate attributed to OpenAI: its internal extended safety monitoring uses roughly 20% of the compute of the inference being monitored, with software spend and human response costed separately.
That ~0.2x ratio reflects an internal cascade, where lightweight detectors screen everything and only flagged cases reach expensive monitors. OpenAI's monitors also read internal model activations that application builders cannot see. An external team verifying a black-box agent with a 100%-coverage frontier judge can easily exceed 1.0x of generation compute.
The surveys show that enterprises report supervisory cost as a significant operational constraint. They do not show that inversion is universal. The worked model below shows how inversion can occur and which assumptions decide whether it does.
Audit Note: Vendor-sponsored research can identify useful operational signals. Before relying on a statistic, check the survey wording, who was surveyed, what the cost definition includes, and the publisher's commercial incentives.
Worked Example: When Does Inversion Occur?
The numbers below are author assumptions for an illustrative compliance-review agent. They are not industry benchmarks.
Assumptions. 50,000 tasks per month. 12 reasoning steps per task. Generation costs \$0.018 per task. The model-based judge costs \$0.0194 per task.
Crucially, the judge does not re-read the full 12-step, 540 KB execution trace, which would be roughly 135,000 tokens per task. Instead, it checks the agent's final output against the retrieved policy excerpts (about 5,000 tokens of context at \$2.50 to \$3.00 per million tokens), which yields \$0.0194.
Each step records 45 KB, and the trace goes to three destinations billed on separate meters. In the baseline, each destination receives 27 GB per month. Instrumentation choices swing this footprint widely, from 12 GB a month for a lean design to 240 GB for a heavy one. The footprint formula and the three scenarios are in the appendix. The monthly costs in the baseline are:
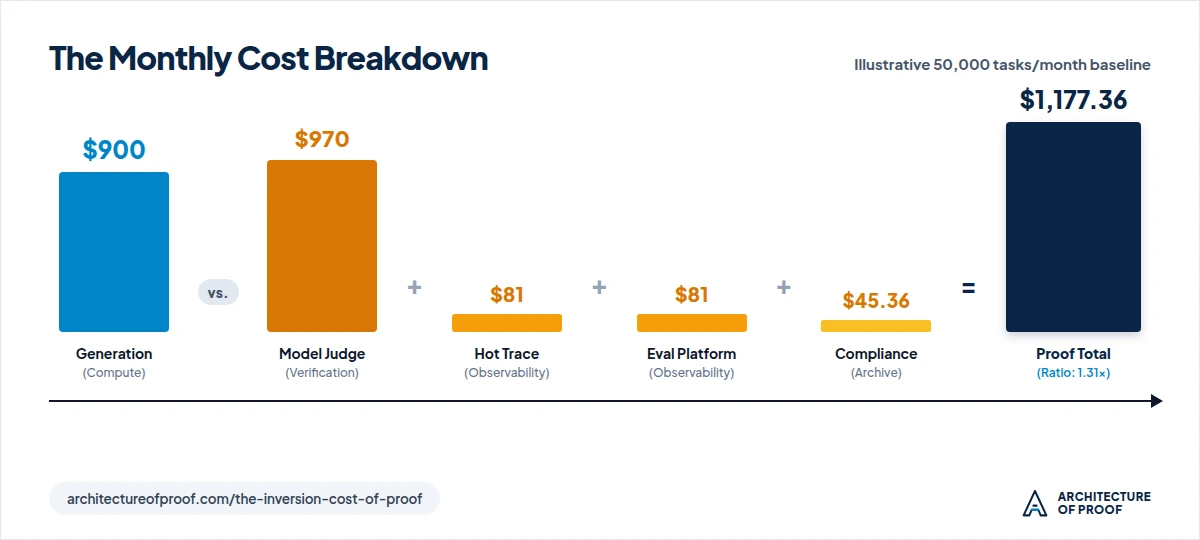
| Cost component | Assumption | Monthly cost |
|---|---|---|
| Generation | 50,000 × \$0.018 | \$900.00 |
| Hot observability platform | 27 GB × \$3.00 per GB ingested | \$81.00 |
| Evaluation platform | 27 GB × \$3.00 per GB ingested | \$81.00 |
| Compliance archive | 27 GB per month retained for 84 months: 2,268 GB × \$0.02 per GB-month | \$45.36 |
| Model-based judge, 100% coverage | 50,000 × \$0.0194 (5,000-token summary prompt) | \$970.00 |
| Proof infrastructure total | Sum of the four supervisory lines above | \$1,177.36 |
The archive line is the monthly run rate at the end of year seven. It assumes constant volume, no deletion before expiry, and unchanged storage pricing. In the first year it would be far lower.
The proof infrastructure total is \$0.024 per task, a Proof Ratio of 1.31. This is a monthly infrastructure estimate. It excludes human review, trace replay, redaction, security controls, replication, and platform engineering. Part III covers the fully loaded figure.
Under these assumptions, full-coverage model-based evaluation crosses the inversion threshold on its own, because the judge (\$0.0194 per task) costs more than generation (\$0.018). Telemetry adds \$207.36 on top. Verification is 82% of the proof infrastructure bill. Reducing the judge to a 20% sample would cut the proof infrastructure total to \$401.36 and the ratio to 0.45. That is arithmetic about this model, not a universally recommended sampling rate. The right coverage depends on the consequence of error.
Why Does Consequence, Not Step Count, Set the Assurance Requirement?
Take two agents.
- Agent A is an internal research assistant. It runs 25 reasoning steps and reads 20 wiki pages. It writes no records and triggers no downstream actions. A wrong summary can still mislead a decision, but a reviewer can usually catch and correct it before anything irreversible happens.
- Agent B is a payment-authorization agent. It runs 3 steps, checks one sanctions list, and approves a wire transfer that cannot be recalled.
Agent A may generate substantially more telemetry. Agent B nevertheless demands stronger controls and more defensible evidence, because the consequences of an incorrect action are greater.
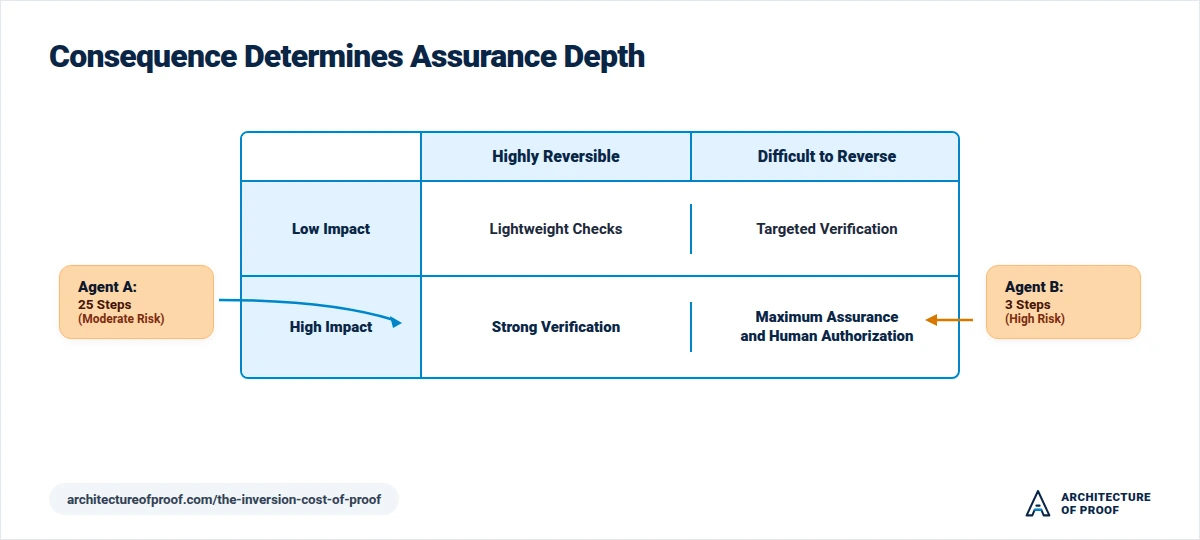
As a conceptual framework:
$$\text{Assurance Requirement} = f(\text{Impact}, \text{Reversibility}, \text{Exposure}, \text{Uncertainty})$$
The cost of proof depends on how much an agent does and on what happens if it is wrong. Part IV builds on this framework.
How Should You Measure Cost: Fully Loaded Cost per Verified Outcome
Cost per token and Proof Ratio both mislead on their own. The commercial measure is the fully loaded cost per verified outcome:
$$FLCVO = \frac{C_{\text{inference}} + C_{\text{proof_infra}} + C_{\text{human_review}} + C_{\text{recovery}}}{N_{\text{verified_outcomes}}}$$
Definition. A verified outcome is a completed decision, approval or rejection, that satisfies the defined acceptance criteria within the measurement period, including decisions resolved through human review. A successful API response is not a verified outcome.
Consider two illustrative designs for a document-underwriting feature that handles 50,000 applications a month, all resolved within the period:
| Component | Option A: cheaper model, full-coverage judge | Option B: stronger model, tiered checks |
|---|---|---|
| Generation | \$250 | \$1,250 |
| Proof infrastructure | \$1,177 | \$400 |
| Human-review escalation rate | 8.0% (4,000 cases) | 1.5% (750 cases) |
| Human review at \$15 per case | \$60,000 | \$11,250 |
| Rework and customer concessions | \$8,500 | \$1,200 |
| Total monthly cost | \$69,927 | \$14,100 |
| FLCVO (50,000 verified outcomes) | \$1.40 | \$0.28 |
Notice where the money actually went in Option A: human review represents 86% of the total bill (\$60,000 out of \$69,927), while proof infrastructure is under 2%.
This reveals the fundamental economic dynamic of agent systems: the telemetry bill is merely the visible tip; escalation labor is the real economic iceberg of proof. When an unverified or cheap model produces higher defect rates, the cost does not appear on your cloud invoice; it overwhelms your human operations queue.
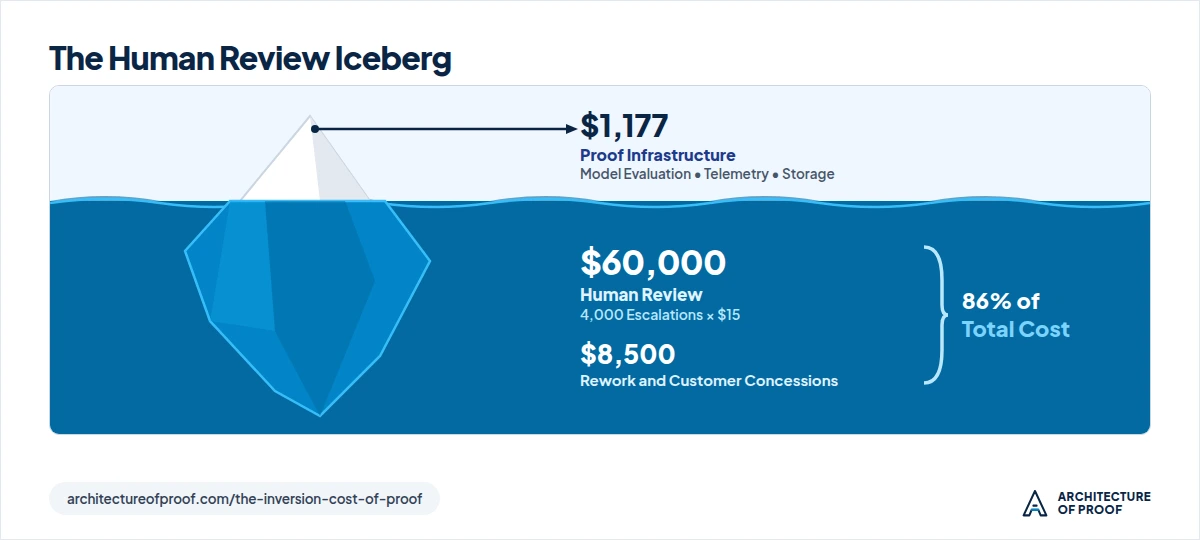
With all other inputs held constant, Option A only achieves a lower FLCVO than Option B if its human escalation rate drops below 0.56%, which is significantly lower than Option B's own 1.5% baseline. The cheaper model is the more expensive product under these assumptions. With different assumptions the ranking can flip, which is why teams must measure their own.
How Do You Design Verification Around Cost?
The cheapest way to establish confidence is rarely a frontier model judging another frontier model. A practical order is to route each check to the least expensive mechanism that can establish the required confidence:
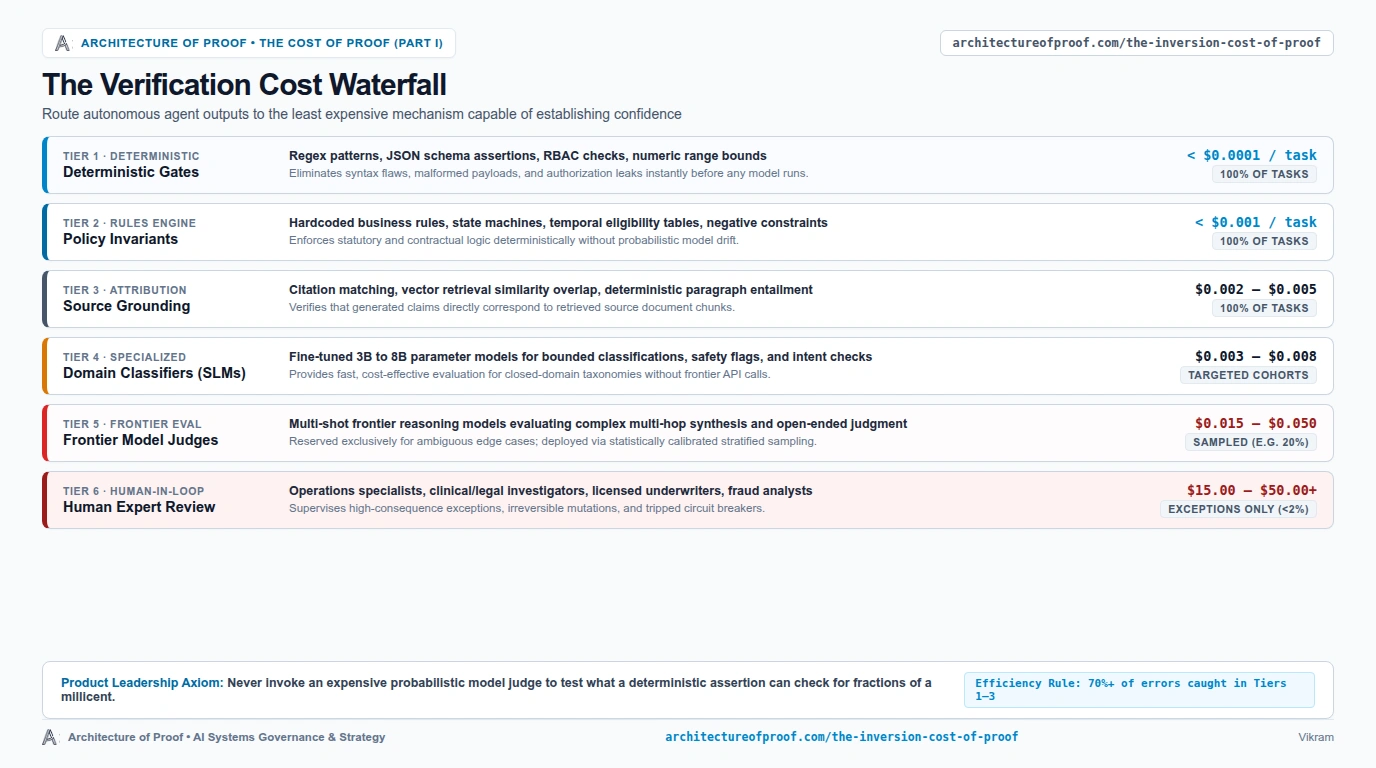
- Deterministic checks for schema validity, authorization, numeric bounds, and prohibited actions.
- Rule-based policy engines for business and regulatory constraints.
- Source-grounded validation, where citation matching, retrieval similarity, and semantic entailment are separate checks with different limits. A match does not prove the claim follows from the source.
- Specialized evaluators for bounded classification tasks. Whether they are cheaper than a frontier judge depends on hosting, throughput, and quality, and has to be measured.
- Frontier model judges for ambiguous reasoning.
- Human review for high-impact exceptions.
Coverage should follow consequence. Deterministic checks can run on every task. High-impact, irreversible, or regulated actions call for broader verification and review, set by the workflow's risk assessment and the requirements that apply to it. Sampling suits routine, reversible work, with calibration for the cohort and the cost of error.
Sampling assumes errors occur independently. A policy-version change, a retrieval fault, or a prompt-injection attack can affect a whole cohort without producing any unusual telemetry. Pair sampling with business-level signals: shifts in approval rates, divergence from current policy versions, and disagreement with deterministic checks. Any thresholds for these signals must be calibrated against a baseline and a time window, and the escalation rule must say how far sampling widens when one trips.
The Adversarial Stress-Test: Five Critical Inquiries
1. What is the strongest argument against this approach?
- The Objection: "Keeping evidence has a cost beyond storage. Retaining raw traces that contain personal data creates privacy, security, and discovery exposure. Keeping less is the safer policy."
- The Practical Resolution: Separate short-lived debug traces from a minimized evidence record. The record links a decision to authenticated inputs, policy versions, authorizations, and the checks applied. Whether it supports reconstruction depends on whether the referenced artifacts remain retrievable, who controls their retention and access, and how policy and document versions are preserved. Set a defined retention period for each artifact type based on evidentiary value, legal obligation, and sensitivity. An evidence record shows what was decided and on what basis. It does not by itself show the decision was correct.
2. Under what circumstances would this fail?
- Correlated errors that sampling misses. An agent that retrieves an outdated policy can make consistent, wrong decisions with normal retry counts and token lengths. Execution telemetry will not flag it.
- The Practical Resolution: Add business-level signals and independent deterministic checks, and revisit sampling rates whenever a model, prompt, or policy changes.
3. What would a skeptical customer or colleague object to?
- The Objection: "Your supervision bill is your problem. Why should we care?"
- The Practical Resolution: The vendor's cost of assurance is a unit-economics problem. A customer's willingness to pay for assurance is a separate commercial question. They connect when assurance capabilities enable adoption in regulated settings or meet requirements competitors cannot. Many buyers will treat basic auditability as a minimum requirement, not a premium feature. Part VI takes this up.
4. Which alternative deserves more consideration?
- Deterministic policy engines. Where a rule can be written down, evaluating it deterministically costs a fraction of any model-based check. The goal is to minimize the number of decisions that need a probabilistic evaluator.
5. What am I assuming that may not be true?
- That more telemetry means more confidence. Terabytes of traces do not establish that an agent decided correctly, and unstructured volume can slow an investigation. More data is not better evidence, more evidence is not better verification, and more verification is not stronger assurance. The goal is sufficient, relevant, trustworthy evidence.
- That the illustrative prices hold. Judge pricing, ingestion pricing, and archive pricing all change, and each changes the result.
The Monday Proof Question
"For our highest-volume production agent, what did we spend last month generating outputs versus checking them, and what did one accepted, policy-compliant outcome cost?"
Three follow-ups to take to engineering, finance, and operations:
- What share of tasks reaches a human, and what drives that rate? If it is above the level your workflow can staff, the model choice is not the problem.
- What does each check cost, and which of them could a deterministic rule replace?
- Which actions are irreversible, and do they get stronger verification than the rest?
One-Line Synthesis
As generation gets cheaper, the cost of establishing that an agent was right can become the larger part of its economics, and the product decisions you make decide whether it does.
Appendix: Trace Footprint Assumptions
The per-task footprint is the number of steps, times the payload per step, times the number of billable logical copies:
$$V_{\text{task}} = N_{\text{steps}} \times S_{\text{payload}} \times M_{\text{copies}}$$
Here $M_{\text{copies}}$ counts billable logical copies, not simply the number of destinations. A trace ingested once and routed to several systems may bill differently at each. The footprint depends heavily on instrumentation choices:
| Scenario | Payload per step | Billable copies | Per task | Monthly volume |
|---|---|---|---|---|
| Lean: references and diffs only | 10 KB | 2 | 240 KB | 12 GB |
| Baseline: full-payload instrumentation | 45 KB | 3 | 1,620 KB | 81 GB |
| Heavy: schema- and document-rich | 100 KB | 4 | 4,800 KB | 240 GB |
Sourcing & Verification Ledger
Evidence tags: [S] figure reported by a named source and confirmed through secondary coverage or press releases, [I] author assumption or framework, [V] primary documentation verified.
| Claim | Tag | Source and caveat |
|---|---|---|
| 59% terminated or delayed a deployment because of monitoring costs | [S] | Apica release of an Omdia research study (June 3, 2026, 300+ IT decision-makers, North America and Western Europe). Self-reported executive sentiment. |
| 69% say observability costs exceed compute in agentic AI projects | [S] | Same study. Stated in the release as share of projects (secondary coverage occasionally refers to share of enterprises). Self-reported sentiment, not audited financial ledgers. Full research report is gated. |
| 9.5x average expected telemetry growth over two years; 44% expect 6x to 100x | [S] | Same study. Survey projection, not an empirical measurement. |
| Cybersecurity, legal/compliance, and fraud top the list of paused use cases | [S] | Same study. Identified in the release as the top paused use cases, though specific percentage breakdowns are not published. |
| 57% report observability cost above monitored infrastructure | [S] | Splunk State of Observability 2026 with Oxford Economics. Broad enterprise IT and engineering population, not agent-specific. |
| 49% attribute 26% to 50% of observability cost to AI workloads | [S] | groundcover 2026 report, 500 US technology professionals. AI workloads broadly, not agentic specifically. |
| OpenAI ~20% extended safety monitoring compute ratio | [S] | Internal frontier model monitoring estimate relayed by Omid Saffari. Refers to internal activation monitoring, not third-party black-box evaluators. Excludes software spend and human response. |
| GPT-4 launch price of \$30 input and \$60 output per million tokens (March 2023) | [V] | OpenAI published launch pricing for the original 8K-context model. Comparison with current models is deliberately not tabulated, since capability and token mix differ. |
| Payload, copies, price, and judge-cost parameters | [I] | Author assumptions for a 50,000-task compliance-review scenario. Includes 5,000-token summary prompt for the judge (\$0.0194). Not industry benchmarks. |
| Worked example totals, Proof Ratio, and sampling arithmetic | [I] | Computed from stated assumptions: \$1,177.36 proof infrastructure total, 1.31 ratio, 82% verification share. Archive line is the month-84 run rate. |
| FLCVO comparison, escalation rates, rework costs, and 0.56% break-even | [I] | Illustrative assumptions modeling human review as the primary cost driver of proof. |
| Assurance requirement function | [I] | Conceptual framework, not a validated formula. |
Subscribe to the Architecture of Proof Dispatch
Rigorous, decision-forcing systems engineering and AI governance monographs for technical leaders. Delivered periodically, zero spam.