Who Owns the Threshold? The Product Decision Hiding Inside Every Model Score
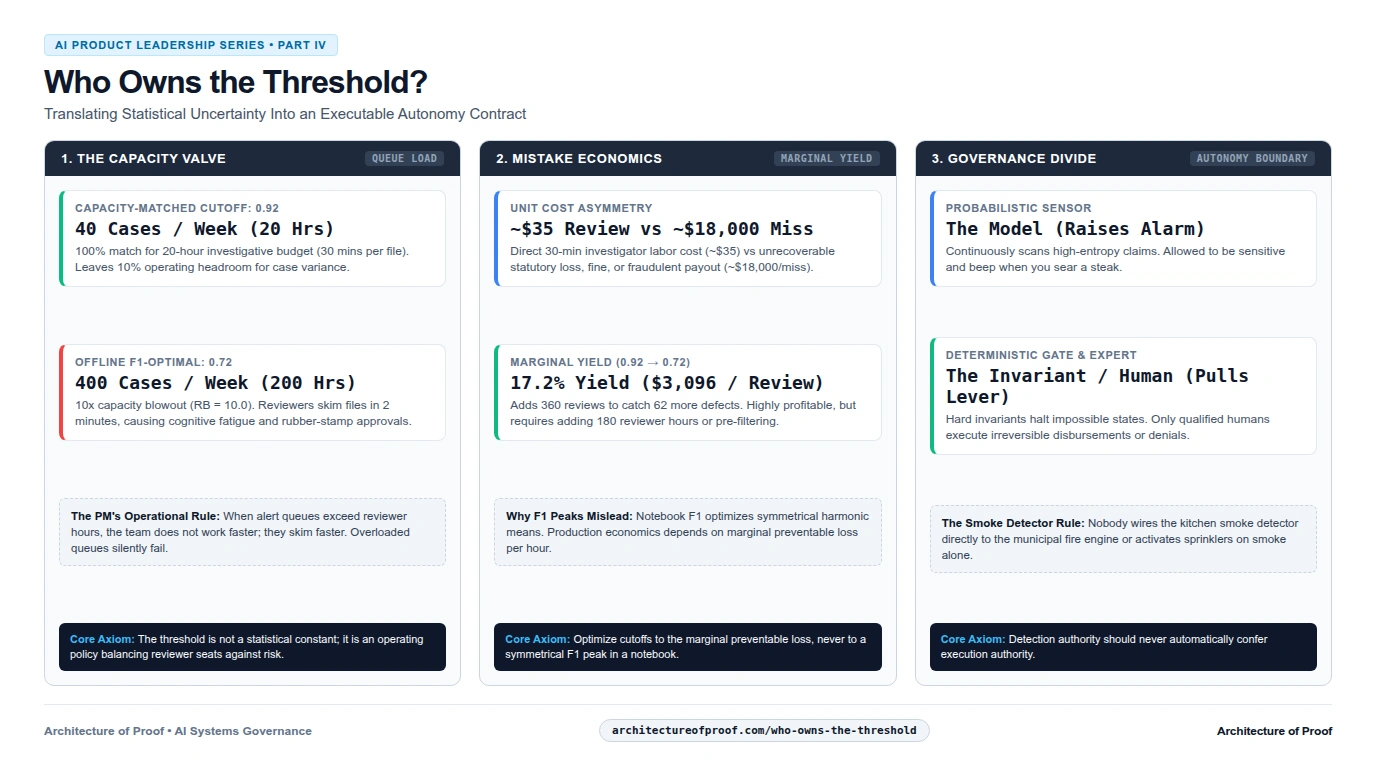
Who Owns the Threshold?
The Product Decision Hiding Inside Every Model Score
Series Notice: Part IV of the AI Product Leadership Series
- ← Part I: The New Product Sense: Knowing When AI Should Stop: Designing Asymmetric Escalation Boundaries and the Friction Vector.
- ← Part II: Systems Judgment: Why AI Product Sense Requires Systems Engineering: Managing Feedback Loops and Second-Order System Dynamics.
- ← Part III: The PM Who Can't Explain the Failure: Why Shipping AI Requires Proof, Pricing Unit Mistake Costs, and Release Contracts.
- Part IV: Who Owns the Threshold?: Translating Statistical Uncertainty into an Executable Autonomy Contract.
The Monday Morning Queue
A senior health insurance claims reviewer sits down at her desk at 8:30 AM on Monday. Her team queue displays 400 flagged claims marked for manual verification before payment.
Her team consists of three experienced investigators. Each thorough, defensible audit of a complex hospital bill takes roughly 30 minutes: examining prior authorizations, cross-referencing clinical procedure notes, and checking medical necessity policies. The team has 20 combined hours per week allocated to this investigative queue (roughly 6 to 7 hours per reviewer alongside their primary claims processing and supervisory duties). At 30 minutes per file, their maximum capacity is 40 in-depth audits per week.
Four hundred cases sit in the queue. The team has the physical capacity to investigate 40.
That leaves 360 claims. Those 360 claims will either sit in the queue until they breach regulatory prompt-payment windows (triggering statutory interest penalties), or the review team will learn to spend two minutes skimming each file, clicking approve on clean-looking screens just to clear the backlog.
Nobody made a malicious leadership decision to drown the claims department. Two weeks earlier, during offline validation on a reference cohort of 10,000 weekly claims, the machine learning squad selected an anomaly risk cutoff of 0.72. On their offline test split, a 0.72 cutoff maximized the F1-score, balancing precision and recall cleanly on historical data.
The data science team believed they were setting a statistical parameter. In reality, they made an operational resourcing decision that overwhelmed a human department on Monday morning.
A Threshold Is an Operating Policy
Many production AI workflows turn a continuous model score into an operational routing or action decision. Before assigning an operational threshold, product teams must establish the direction of the score:
- Target Event Risk Score $S_{\text{risk}}$: In fraud detection, billing integrity, or credit risk, higher scores indicate greater probability of a defect. Raising the cutoff lets more cases clear automatically and reduces review volume.
- Model Confidence Score $S_{\text{conf}}$: In document extraction or automated code conversion, higher scores indicate certainty that an output is correct. Raising the cutoff demands greater certainty for automation and increases review volume.
flowchart LR
    Score["Raw Anomaly Risk Score<br/>S_risk from 0.00 to 1.00"] --> Valve{"Threshold Cutoff<br/>(Operating Policy)"}
    Valve -->|"S_risk <= Cutoff"| Auto["Autonomous Processing<br/>(Zero Review, Instant Settlement)"]
    Valve -->|"S_risk > Cutoff"| Queue["Human Review Queue<br/>(20 Allocated Weekly Hours)"]

    Queue --> Overload{"Queue > 40 Cases?"}
    Overload -->|"Yes (360 Overflow)"| RubberStamp["Superficial Human Skimming<br/>(Rubber-Stamp Approvals)"]
    Overload -->|"No (<= 40 Cases)"| Forensic["Thorough Audit<br/>(30 Min Forensic Verification)"]

    style Valve fill:#e1f5fe,stroke:#0288d1,stroke-width:2px
    style RubberStamp fill:#ffebee,stroke:#c62828,stroke-width:2px
    style Forensic fill:#e8f5e9,stroke:#2e7d32,stroke-width:2px
A score does not determine its own operational consequence; an explicit policy must translate it into an action. That policy must satisfy four distinct constraints simultaneously:
- Operational Capacity: How many cases can available human seats audit before cognitive fatigue causes error rates to spike?
- Economic Tolerance: How much direct human investigation expense can the unit economics absorb versus the expected preventable loss from uncaught defects?
- Statutory & Policy Boundaries: What legal rules, prompt-payment windows, or compliance mandates forbid automated action regardless of queue volume?
- Enterprise Risk Appetite: What is the maximum allowable financial exposure or brand damage the organization will tolerate in unmonitored tail risk?
Data scientists evaluate models using an ROC curve in a Jupyter notebook. An ROC curve treats false positives and false negatives as abstract coordinates on a two-dimensional grid. It does not know how many investigators work in your operations hub, what an hour of investigator payroll costs, or what statutory fine attaches to an improper denial.
Who owns the slider?
No single function can set the threshold in isolation. Data Science cannot set it alone because they do not carry operational P&L accountability. Operations cannot set it alone because they will naturally push the risk cutoff higher to suppress alerts and protect their queues. Risk and Compliance cannot set it without understanding model calibration and capacity limits.
The Product Manager owns the business integration. The PM is the single leader accountable for the product's Autonomy Contract: reconciling statistical calibration, human operational capacity, economic tolerance, and compliance boundaries into an executable release.
One Worked Example: What Each Cutoff Costs
All figures below are illustrative. Each scenario evaluates the same reference cohort of 10,000 weekly claims containing 100 true billing defects (1.0% prevalence), an available review capacity of 20 hours (40 cases at 30 minutes each), and an assumed average loss of \$18,000 per undetected fraudulent bill.
When product teams present model performance to executive leadership, they routinely hide behind 2x2 confusion matrices, micro-averaged F1-scores, and Area Under the Curve (AUC) statistics.
To make an executive decision, translate the confusion matrix into an operating plan using three concrete measures:
- Review Burden ($RB$): Required review hours divided by available productive review hours. $$\text{Review Burden } (RB) = \frac{\text{Flagged Cases} \times 0.5 \text{ Hours}}{\text{Available Review Hours (20 Hours)}}$$ When $RB > 1.0$, the queue exceeds human bandwidth, causing backlogs or superficial skimming.
- Review Yield: Confirmed actionable defects detected per completed review. In a queue where 80 defects are found across 400 reviews, the review yield is 20% (one true defect caught per five reviews conducted).
- Residual Exposure: The financial loss from defects that escape detection in that weekly cohort.
flowchart TD
    subgraph Reality["Weekly Cohort: 10,000 Claims (100 True Defects @ \$18k Avg)"]
        D_Hit["80 Defects Caught<br/>(\$1.44M Loss Prevented)"]
        D_Miss["20 Defects Missed<br/>(\$360,000 Residual Exposure)"]
        Clean["9,900 Clean Claims"]
    end

    Reality --> Model{"Model at 0.72 Cutoff"}

    Model -->|"Flags 80 True Hits"| Queue["Human Review Queue: 400 Total Cases (200 Hours)"]
    Clean -->|"Flags 320 False Alarms"| Queue
    Model -->|"Misses 20"| Leakage["Silent Leakage: \$360,000 / Week"]

    style Reality fill:#fff3e0,stroke:#f57c00
    style Queue fill:#ffebee,stroke:#c62828,stroke-width:2px
    style Leakage fill:#fce4ec,stroke:#880e4f
Now compare three operating configurations for this 10,000-claim cohort:
| Operating Cutoff ($S_{\text{risk}}$) | True Hits / Misses | False Alarms | Total Reviews | Precision / Recall | Model F1 Score | Review Burden ($RB$) | Marginal Review Yield | Residual Weekly Loss | Operating Assessment |
|---|---|---|---|---|---|---|---|---|---|
| Sensitive (0.60) | 88 hit / 12 miss | 620 false pos | 708 cases (354 hrs) | 12.4% prec / 88.0% rec | F1 = 0.217 | $RB = 17.7$ | 2.6% yield (8 hits / 308 reviews) | \$216,000 | Unexecutable: Overwhelms team by 17x. Requires adding 11 dedicated full-time reviewers. |
| F1-Optimal (0.72) | 80 hit / 20 miss | 320 false pos | 400 cases (200 hrs) | 20.0% prec / 80.0% rec | F1 = 0.320 (Peak) | $RB = 10.0$ | 17.2% yield (62 hits / 360 reviews) | \$360,000 | Unfeasible Under Current Staffing: 10x capacity blowout. Leaves 360 cases unreviewed. |
| Capacity-Matched (0.92) | 18 hit / 82 miss | 22 false pos | 40 cases (20 hrs) | 45.0% prec / 18.0% rec | F1 = 0.257 | $RB = 1.0$ | Baseline top slice (18 hits / 40 reviews) | \$1,476,000 | Nominal Capacity Match: Fits 20-hour budget. However, leaks \$1.48M weekly in uninspected fraud. |
The Economic Calculation: Marginal Preventable Loss
Examining the marginal shift between thresholds reveals the true economic trade-off:
- Shifting from 0.92 to 0.72: Adds 360 manual reviews to catch 62 additional fraudulent claims. That represents a 17.2% marginal yield, preventing an expected $\$18,000 \times 0.172 = \$3,096$ of loss per additional review. Against a direct \$35 human review cost, this expansion is highly profitable. However, it requires adding 180 reviewer hours (either 6 dedicated FTE investigators at 30 review hours/week, or automated pre-filtering).
- Shifting from 0.72 to 0.60: Adds 308 manual reviews to catch only 8 additional defects. That represents a 2.6% marginal yield, preventing \$468 of loss per review. While still strictly positive against the \$35 direct labor cost, the operational friction, investigator burnout, and delay to clean claims begin to erode net ROI.
Declaring an F1-optimal threshold without staffing the required hours does not reduce risk; it simply converts systematic fraud into unmonitored human skimming.
Ranking Scores vs. Calibrated Probabilities
A score can support ranking and routing without being a literal probability. In fraud and anomaly detection, raw model scores are typically continuous hazard indices ($S_{\text{risk}} \in [0.00, 1.00]$).
However, if leadership interprets the score as an expected loss probability ($\text{Expected Loss} = S \times \text{Claim Value}$), calibration is mandatory. Discrimination (AUC) only proves the model ranks bad claims above good ones; calibration proves an assigned score of 0.80 corresponds to an empirical 80% failure rate in production. Without calibration, expected loss arithmetic collapses.
Scores, Rules, and Execution Authority
Reliable systems separate statistical pattern recognition from deterministic policy enforcement.
Product architectures must distinguish between two types of deterministic rules: 1. Deterministic State Invariants: Impossible logical or physical states (such as a post-operative check dated prior to surgery, duplicate claim submissions, or sanctions list matches). These are non-negotiable hard blocks that halt processing with zero model dependency. 2. Deterministic Policy Heuristics: Traditional rule thresholds (such as flagging revenue drops over 20% or executive turnover). These heuristics capture meaningful risk signals but benefit from probabilistic LLM synthesis to contextualize exceptions.
The Model Blind Spot: Failing on a State Invariant
Consider an outpatient arthroscopic knee repair claim: * Patient: 48-year-old male. * Billing Codes: Standard facility fees, orthopedic surgery codes, routine anesthesia units. * Dollar Amount: \$6,450 (comfortably within historical P50-P75 range). * Provider History: Normal billing frequency, established regional clinic.
The neural classifier evaluates these continuous inputs against its trained distribution. Every single feature looks normal. The model outputs a low risk score of 0.21 (well below the 0.72 review threshold). In an unmonitored setup, this claim pays automatically in three seconds.
There is one critical issue: the claim lists a post-operative recovery check on June 14, while the outpatient surgical procedure is recorded as June 18.
In this illustrative case, the model fails to enforce the temporal relationship because both dates were simply valid timestamps attached to orthopedic procedure codes. A deterministic invariant check makes that constraint explicit, auditable, and testable:
# Deterministic State Invariant (Layer 0 Gateway Rule)
# Validates that post-operative checks cannot occur prior to the procedure date
if claim.recovery_check_date < claim.surgery_date:
    return QuarantineAction(
        reason_code="INVALID_TEMPORAL_SEQUENCE",
        escalate_to="INTEGRITY_AUDIT_QUEUE",
        bypass_model_scoring=True
    )
The deterministic check catches an impossible sequence in two milliseconds using three lines of standard code.
The Reverse: The Rule Panicked, The Model Clarified
Now consider the reverse dynamic. An enterprise commercial borrower applies for a working capital credit line.
A deterministic credit policy heuristic states: * If the business has had any C-suite executive departure in the past 12 months, or if quarterly revenue dropped by more than 20% year-over-year, flag for audit rejection.
The borrower's financials trip both heuristic tripwires: revenue declined 24% year-over-year, and their Chief Operating Officer departed in Q2. Under a blunt rule engine, the application is denied.
Here, a document extraction and reasoning model reads the underlying financial disclosures and corporate filings: * The revenue drop occurred because the company spun off an unprofitable regional subsidiary for \$14M in cash, which sits on their balance sheet. * The departing executive left to lead that newly independent spinoff entity. * The ongoing core business expanded gross operating margins from 18% to 31%.
The model synthesizes these non-standard notes, identifies the balance sheet cash influx, and outputs a low anomaly risk score of 0.08 (indicating standard operating health).
Crucially, the model does not independently override the credit policy. Instead, it generates a structured contextual dossier that enables human underwriters to grant a documented policy exception in ten minutes rather than rejecting an exceptional enterprise client.
flowchart TD
    Payload["Incoming Case Payload"] --> L0{"Layer 0: Deterministic Invariants<br/>(State Checks & Statutory Rails)"}

    L0 -->|"Hard Invariant Breach<br/>(Temporal bug, sanctions list)"| Block["Deterministic Quarantine / Rejection<br/>(Zero Model Dependency)"]
    L0 -->|"Passes Invariants"| L1["Layer 1: Probabilistic Model<br/>(Calibrated Risk Scoring)"]

    L1 --> Score["Risk Score S_risk"]
    Score --> Valve{"Threshold Contract"}

    Valve -->|"Tier 1 (S <= 0.40)"| Approve["Autonomous Processing<br/>(9,200 Claims - 92% Volume)"]
    Valve -->|"Tier 2 (0.40 < S <= 0.80)"| Assisted["Assisted Review<br/>(760 Claims - Layer 0 Pre-Clears 720)"]
    Valve -->|"Tier 3 (S > 0.80)"| Forensic["Full Forensic Audit<br/>(40 Complex Claims - 20 Review Hours)"]

    style L0 fill:#fff3e0,stroke:#f57c00,stroke-width:2px
    style Block fill:#ffebee,stroke:#c62828
    style Approve fill:#e8f5e9,stroke:#2e7d32
    style Assisted fill:#e1f5fe,stroke:#0288d1
    style Forensic fill:#f3e5f5,stroke:#7b1fa2
The Smoke Detector Analogy
A household smoke detector is an inexpensive, highly sensitive sensor. Its job is to detect particulate matter in the air and raise an alarm.
flowchart LR
    Smoke["Smoke Detected"] --> Detector["Smoke Detector<br/>(Probabilistic Sensor)"]

    Detector -->|"Raises Alarm"| Adjudicator["Human Adjudicator<br/>(Evaluates Context & Invariants)"]

    Adjudicator -->|"Burned Toast"| Fan["Local Reset<br/>(Open Window / Clear Alarm)"]
    Adjudicator -->|"Verified Fire"| Sprinkler["Consequential Execution<br/>(Discharge Extinguisher / Call 911)"]

    Detector -.->|"AVOID DIRECT COUPLING"| Municipal["Direct Wire to Sprinklers<br/>& Municipal Fire Engine"]

    style Detector fill:#fff3e0,stroke:#f57c00
    style Adjudicator fill:#e1f5fe,stroke:#0288d1,stroke-width:2px
    style Municipal fill:#ffebee,stroke:#c62828,stroke-dasharray: 5 5
    style Sprinkler fill:#e8f5e9,stroke:#2e7d32
A smoke detector is allowed to be sensitive. It is designed to beep loudly when you sear a steak in an open skillet. A false alarm is mildly annoying, but you wave a towel at the sensor, open a kitchen window, and return to cooking.
What nobody does is wire the kitchen smoke detector directly to the municipal fire station or configure it to trigger industrial ceiling sprinklers on its own.
The governing principle is:
The authority to detect a possible problem should not automatically confer authority to take every consequential action.
Execution authority depends on reversibility, potential harm, verified constraints, and the approved operating policy. The model detects and scores; deterministic invariants and human experts adjudicate; only verified workflows execute irreversible transactions.
The Autonomy Contract
Before transferring threshold management from ad-hoc notebook experiments to production, enterprise teams must document an Autonomy Contract.
This is not a vague governance charter; it is a compact, versioned release instrument that specifies the exact operational boundaries of the feature:
| Contract Field | Specification for Claims Anomaly Workflow (Weekly 10,000 Cohort) |
|---|---|
| Score Meaning | Continuous risk hazard score ($S_{\text{risk}} \in [0.00, 1.00]$). Higher scores indicate greater probability of billing defect. |
| Routing Policy & Tier Breakdown | • Tier 1 ($S \le 0.40$): 9,200 claims auto-approved with 1% retrospective audit. • Tier 2 ($0.40 < S \le 0.80$): 760 claims. Automated invariant pre-filters clear 720 routine cases; remaining 40 claims route to reviewers with pre-filled dossiers (15 mins each = 10 review hours). • Tier 3 ($S > 0.80$ or Invariant Breach): 40 complex claims route to full forensic audit (30 mins each = 20 review hours). |
| Capacity Envelope | 30 total weekly review hours across 3 reviewers (20 hours for Tier 3 forensics, 10 hours for Tier 2 assisted checks). Review Burden sits at $RB = 0.90$, providing 10% operating headroom for case variance. |
| Economics | Average cost per 30-min forensic review: \$35. Average loss per undetected defect: \$18,000. Expected weekly residual exposure capped at \$360,000. |
| RACI Authority Matrix | • Accountable (Integrator): Product Management. • Approving (Veto Authority): Risk & Compliance (Tail Risk), Operations (Staffing). • Consulted (Validation): Data Science Lead (Calibration), Legal (Statutory Mandates). • Informed: Executive Committee. |
| Overload Fallback Policy | If weekly Review Burden $RB > 1.25$ for two consecutive cohorts: do not flood human queues. Automatically throttle new batch intake, invoke deterministic rules-only gates on Tier 2, and activate 10 hours of pre-trained surge review capacity. |
| Monitoring & Sampling | Daily review queue age, weekly review yield, automated data drift alerts, and stratified retrospective sampling of Tier 1 auto-approvals (92 claims/week audited asynchronously by senior quality audit staff). |
| Change Control | Version 1.2. Effective date: November 1, 2026. Next scheduled review: 90 days. Rollback target: Rules-Only Baseline (Tier 0). |
Monitoring the Policy After Release
A threshold is not a static constant set at launch. It is a dynamic operating policy subject to three post-release failure modes:
1. Selective-Label Bias (Threshold Masking)
When an operational threshold routes high-risk cases to human review while low-risk cases pass through automatically, the organization only generates verified ground-truth labels for the escalated queue. Over several quarters, the evaluation dataset becomes completely blind to false negatives occurring in the unreviewed auto-approved volume.
The Operating Fix: Implement stratified retrospective sampling. Rather than taking an arbitrary flat sample, stratify unreviewed auto-approved cases across claim dollar value, provider risk tier, and procedure category. Route these stratified samples to senior auditors for retrospective grading to continuously monitor false-negative rates in the wild.
2. Capacity Creep and Queue Inflation
If Operations controls the risk cutoff without product economic oversight, they will naturally raise the cutoff from 0.72 to 0.92 to suppress alerts and eliminate overtime. In doing so, they silently leak \$1,116,000 in unmonitored defects per cohort. Conversely, if Marketing or Sales lowers the cutoff to promise zero fraud, queues instantly collapse into rubber-stamping.
The Operating Fix: Track the Review Yield weekly. If review yield drops below 10%, the threshold is generating excessive false alarms for current capacity. If yield climbs above 50%, the threshold is too restrictive and leaking defects in the unflagged volume.
3. Reviewer Ergonomics and Cognitive Dilution
A review queue with 40 cases is not healthy simply because nominal capacity is 40. If the investigative interface forces reviewers to toggle between four disconnected legacy databases, re-type patient IDs, or decode raw model feature vectors, reviewers experience severe cognitive fatigue within 90 minutes.
The Operating Fix: Product managers must design the internal review tool with the same UX rigor applied to consumer apps. Provide structured evidence dossiers, highlighted document spans, and explicit causal notes so human oversight remains a genuine audit rather than a superficial compliance ritual.
The Adversarial Stress-Test: Five Critical Inquiries
Before greenlighting model autonomy, evaluate the five hardest inquiries your executive committee will raise.
1. What is the strongest argument against this approach?
- The Objection: "Human review capacity cannot be the primary constraint governing an operating threshold. In high-consequence medical diagnostics or statutory anti-money laundering, an organization cannot let fraud or patient harm pass simply because the review queue is full. Risk appetite and legal compliance must dictate the threshold regardless of operational inconvenience."
- The Practical Resolution: When statutory risk tolerance dictates an alert volume that exceeds human capacity, leadership cannot simply mandate a sensitive threshold and assume the risk is handled. If the required threshold generates 400 cases for a 40-case team, the unaddressed shortfall causes unmonitored rubber-stamping. Leadership must fund additional staffing, narrow the automated feature scope, or throttle incoming transaction volume. The threshold exposes the real resourcing cost of compliance.
2. Under what circumstances would this fail?
- Threshold Masking and Unmonitored Drift: If incoming claim formats shift or new fraud syndicates exploit features not captured in training data, the model's risk scores remain low. The system silently approves fraudulent claims without alerting humans, while the team's review queue appears clean and manageable.
- The Practical Resolution: Pair operational threshold monitoring with stratified retrospective sampling of auto-approved cases. Oversample high-dollar payouts and unusual procedure clusters, submitting them to weekly blind expert audits. If retrospective audits detect an uptick in missed defects, trigger automated circuit breakers to recalibrate the model.
3. What would a skeptical customer, client, or colleague object to?
- The Customer Delay Objection: "Routing every borderline transaction to a manual queue delays legitimate customer payouts by days, damaging customer retention while competitors approve claims instantly."
- The Practical Resolution: Separate blocking holds from asynchronous audits. Irreversible transactions (e.g., wire transfers over \$50,000 or irreversible denials) justify synchronous holds. Lower-risk, reversible actions can settle immediately for the customer while triggering an asynchronous post-settlement audit that recovers funds if post-hoc inspection discovers systemic fraud.
4. Which alternative deserves more consideration?
- Sampling-Based Statistical Process Control (SPC) with Asynchronous Post-Settlement Audits: Rather than holding transactions in synchronous queues at the point of processing, allow standard transactions to settle under automated deterministic checks, routing a dynamic, risk-weighted sample to post-settlement forensic recovery teams. This maintains zero friction for legitimate customers while isolating human capacity strictly to asset clawback and provider remediation.
5. What am I assuming that may not be true?
- Reviewer Accuracy Remains Constant Under Queue Pressure: This architecture assumes that human investigators maintain 95%+ audit fidelity if the queue fits within nominal capacity. In practice, if review software has fragmented navigation, missing context, or high interface friction, reviewers miss obvious fraud even when case counts appear modest. Product leaders must audit reviewer error rates alongside model accuracy.
One-Line Synthesis
A model score is a statistical signal, not an authorization to act. The cutoff threshold translates that signal into an operating policy, but product leadership owns the broader Autonomy Contract: reconciling statistical calibration, human review capacity, and enterprise risk appetite into a governed production system.
Subscribe to the Architecture of Proof Dispatch
Rigorous, decision-forcing systems engineering and AI governance monographs for technical leaders. Delivered periodically, zero spam.