Autonomy Is a Cost Multiplier: How Ordinary PRD Decisions Change the Economics of Agentic Products
The Cost of Proof, Part II of VII · Architecture of Proof
Series Architecture: The Cost of Proof
Observability records what an agent did. Verification checks whether the result is correct. Assurance proves the decision is safe and defensible. This series examines what it costs to build that confidence, and how everyday product decisions change that cost.
- ← Part I: The Inversion: When Assuring an AI Agent Costs More Than Running It.
- Part II (This Article): Autonomy Is a Cost Multiplier: How Ordinary PRD Decisions Change the Economics of Agentic Products.
- Part III (Upcoming): Unit Economics With Proof Included: The Fully Loaded Cost per Verified Outcome.
- Part IV (Upcoming): Tiered Proof: Matching Evidence Depth to Blast Radius and Reversibility.
- Part V (Upcoming): Who Owns the Bill?: Bridging the Product, FinOps, and SRE Divide.
- Part VI (Upcoming): Proof as Product: Monetizing Auditability, Replayability, and Verifiable Autonomy.
- Part VII (Upcoming): The 90-Day Playbook: Operationalizing the Proof Layer.
The Short Version
Letting an AI agent try harder (more steps, more retries, more memory) costs more than it looks like. Four things to do before you approve that in a product requirements doc:
- Decide separately how hard the agent may work and what it may do on its own. Thinking longer helps an agent analyze a harder problem. It gives the agent no extra right to approve a refund, send an email, or sign a contract. A person still approves those.
- Fix the cheap problems first. Give each step only the tools it needs, and stop retrying when a retry cannot help (for example, a page is missing from the upload). In our contract-review example, these two changes capture 58% of the possible savings before you build anything more complex.
- Look at the worst runs, not the average. In our onboarding example, 15% of tasks get stuck in retry loops, and those tasks use 56% of the compute and checking cost and 91% of the human review time.
- Before you raise the agent's limits, ask for proof. The question: "If we let the agent do more tomorrow, can we show from test data that the extra problems it solves are worth more than the extra compute, checking, and human cleanup?"
Three questions to take to your team:
- Engineering: "How many steps and retries does a typical run take, and how many does the slowest 1 in 20 (and 1 in 100) take? What has to change before a failed step may try again?"
- Finance / Platform: "How much of our monthly compute, testing, and logging bill comes from the slowest 15% of runs?"
- Product / Operations: "Of the runs that retry more than once, how many end with a correct automatic result, and how many still land in the human review queue?"
The PRD Change That Paid Off Overall, While Multiplying Waste in the Tail
Consider a situation where a merchant-onboarding agent processes 50,000 applications a month. During pre-launch testing, about 1 in 8 applications still ends up with a human, at \$15 each. Most of those escalations come from complex cases: the 15% of applications where a corporate registry lookup times out or an uploaded filing uses an unfamiliar layout.
To fix this before launch, the product manager changes three settings in the agent's product requirements:
- Give the agent more actions per application (raising the cap from 5 steps to 20). A "step" is one action: querying a registry, searching an uploaded PDF, or checking a watchlist. Simple applications finish in 3 or 4 steps. Complex applications with multiple business owners or long documents were hitting the 5-step cap halfway through and quitting. Raising the ceiling gives the agent enough runway to finish them.
- Allow up to 3 automatic retries when a tool call or check fails, rather than giving up immediately.
- Keep the entire document text in memory across every step, and log every turn for debugging.
The edits pay off on paper. The agent now resolves 1,125 more applications a month on its own. That saves \$16,875 in manual review labor, against roughly \$1,800 in extra compute and defect cleanup, so the net gain is about \$15,000 a month.
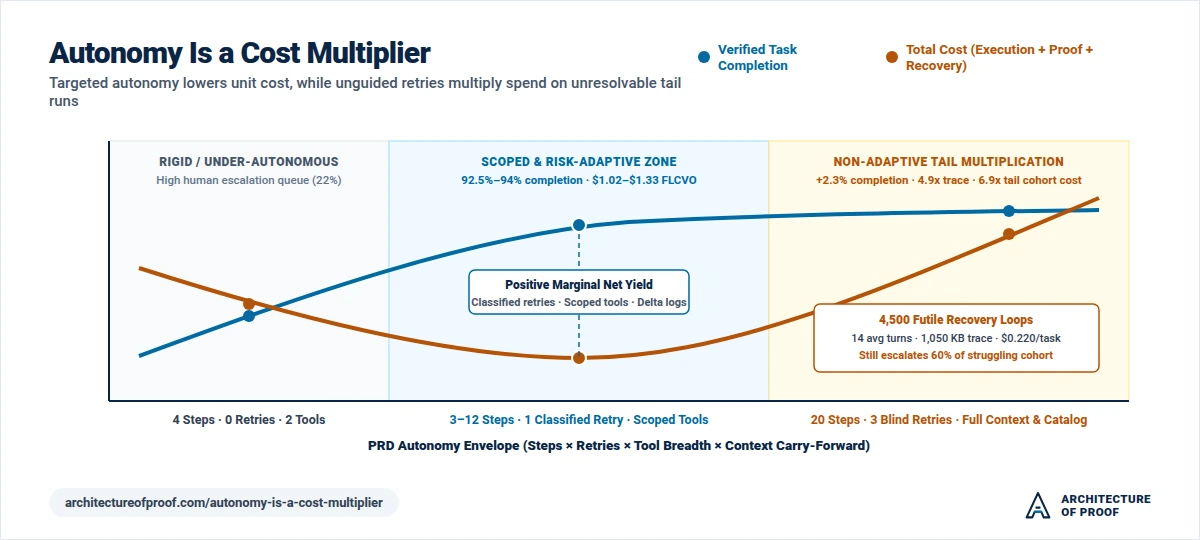
The problem is where the rest of the new spending goes. Straightforward applications (85% of the volume) barely change. On the complex cases, though, 4,500 applications now loop through an average of 14 steps (some exhausting their 3 retries by step 11, others hitting the full 20-step cap) before giving up and landing on a human's desk anyway. Those tasks cost about seven times more than before and recover nothing:
| Complex cases only | Before the edits (5-step cap) | After the edits (20-step cap) |
|---|---|---|
| Average steps per task | 5 | 14 |
| Compute and checking cost per task | \$0.03 | \$0.22 (about 7x) |
| Share still sent to a human | 75% | 60% |
Across all 50,000 applications, the automatic completion rate rises from 87.9% to 90.2%.
Note: These are author assumptions for an illustrative model. The step-by-step arithmetic is in the appendix.
I see this pattern often when I review agent PRDs with product and platform teams. More autonomy is not automatically wasteful or automatically cheap. It pays off on the edge cases it actually resolves, and it burns money on the ones it cannot. The product leader's job is to keep the 1,125 extra resolutions without paying for 14-step loops on the 4,500 runs that were never going to succeed.
Where the Money Goes: The Four Cost Dimensions of Autonomy
Published engineering benchmarks confirm how quickly autonomous loops multiply resource consumption: in Anthropic's production data for its multi-agent research system, single-agent tool loops typically consume about 4x more tokens than a direct single-pass call (which their benchmark measures as a standard prompt-and-response chat interaction without tools), and multi-agent architectures consume about 15x more tokens.
Token bills are only the first layer. To evaluate roadmap trade-offs accurately, product leaders should separate four cost dimensions that respond differently when an agent is granted more latitude:
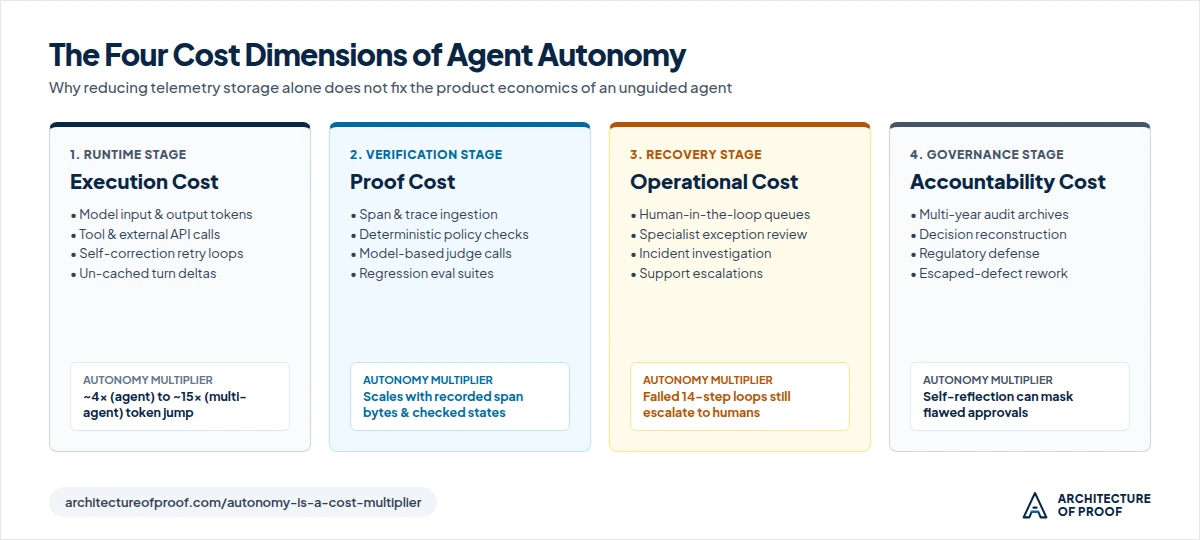
| Cost dimension | Stage & scope | How increased autonomy affects it |
|---|---|---|
| 1. Execution cost | Runtime: Model tokens, external tool API calls, retries, and orchestration compute | Scales with turn count, conversation length, and retry frequency (partially offset if prompt caching discounts repeated prompt tokens) |
| 2. Proof cost | Verification: Logging telemetry, running automated assertions, model-judge evals, and audit checks | Scales with the volume of logged traces and how many intermediate decisions must be checked |
| 3. Operational cost | Recovery: Human review queues, exception triage, and customer support escalations | Drops when extra turns resolve edge cases autonomously; spikes when pointless retry loops burn compute and still dump tasks into the human queue |
| 4. Accountability cost | Governance: Audit archive retention, replaying decisions for compliance, and fixing customer-facing defects | Rises when complex execution paths make decisions hard to audit or let subtle errors escape into production |
Lumping these four costs together leads teams to optimize the wrong line item. For example, restricting an agent too aggressively to save \$0.05 in model tokens can cause it to halt on minor formatting quirks, instantly triggering a \$15.00 human review chore. Conversely, slashing log storage saves a few dollars on telemetry, but blinds the team to why thousands of runs are failing and generating manual review tickets. You cannot manage an agent by looking at your model invoice alone.
Context Exposure vs. Billed Tokens and Recorded Telemetry
Traditional software follows a predictable path. A request runs through fixed code, taking roughly the same time and logging the same data whether it is the median request (p50) or in the slowest 1% (p99). An autonomous agent replaces that fixed path with a dynamic loop: it plans, calls a tool, inspects the result, and decides whether to keep going.
Inside that loop, input data compounds fast. On every turn, the agent sends the original prompt plus the growing conversation history back to the model. Across a 14-turn run, re-sending that history means the model processes 1,050 KB of cumulative text (derived in the appendix). What model providers bill is lower if prompt caching is active, since repeated prompt text usually gets a 50% to 90% discount, while new tool outputs and model responses bill at full price.
Your logging bill follows a different meter. If engineering configures the system to save the entire conversation history on every single step, it records all 1,050 KB. If they instead record document IDs and only the specific changes made at each step (state diffs), it logs just 155 KB for that exact same 14-turn run. Finally, what your observability, evaluation, and archive vendors charge depends on sampling, compression, and how many destinations receive a copy of the trace.
Five Ordinary PRD Choices That Multiply Cost and Complexity
The most consequential cost commitments in agentic products rarely appear as infrastructure decisions. They enter PRDs as user-experience or reliability requirements:
| PRD requirement & intended benefit | Mechanism of cost multiplication | Better PRD specification |
|---|---|---|
| 1. Generous step limits "Allow up to 20 steps so complex tasks finish." |
Lets doomed runs burn through model calls, external tools, and traces before timing out | Separate routine traffic from complex traffic: give normal tasks a strict 4-step cap, and unlock an extended ceiling (e.g., 12 to 20 steps) only when an upfront check identifies a complex task |
| 2. Blind reflection retries "If a check fails, let the agent reflect and retry up to 3 times." |
Wastes compute retrying unrecoverable errors (such as missing files or invalid permissions) that reflection can never fix | Classify error types: retry once on temporary network drops (HTTP 429/503) or repairable schema errors; fail fast on missing source data |
| 3. Unscoped tool catalogs "Expose all 16 internal tools so the agent can pick what it needs." |
Giving the agent too many tools at once increases wrong-tool selections, prompts confusion, and inflates the prompt with tool definitions | Scope tool availability per workflow stage so the agent chooses among 2 to 4 relevant tools at any given moment |
| 4. Carrying full documents in memory "Keep full retrieved documents in working memory across turns." |
Re-sends thousands of tokens on every subsequent turn and inflates log storage if full payloads are saved | Pass structured extracted facts and document reference IDs between steps, fetching raw text chunks only when needed |
| 5. Multi-agent chat handoffs "Use Planner, Researcher, and Critic agents to cross-check work." |
Multiplies token spend and latency as agents re-read each other's entire conversational transcripts | Require clear proof that multiple agents beat a single agent on cost or accuracy; pass clean structured data between agents instead of chat transcripts |
Engineering can soften some of these costs: dynamic tool loading keeps prompts short, and simple code assertions are much cheaper than model judges. But the product rule is straightforward: every extra step, tool, or retry you grant an agent must resolve enough additional customer tasks to pay for itself.
The Heavy Tail: Why Happy-Path Averages Mislead Product Teams
Product dashboards typically center on averages: average cost per task, average step count, and overall completion rate. In autonomous systems, averages obscure the heavy tail that governs unit economics.
In our post-edit merchant-onboarding workload of 50,000 applications, the 85% normal cohort (42,500 applications at \$0.031 technical spend and 1.0% human escalation) behaves predictably. The 15% complex cohort (7,500 applications at \$0.220 technical spend and 60.0% human escalation at \$15 per case) drives the majority of both technical spend and human operations labor:
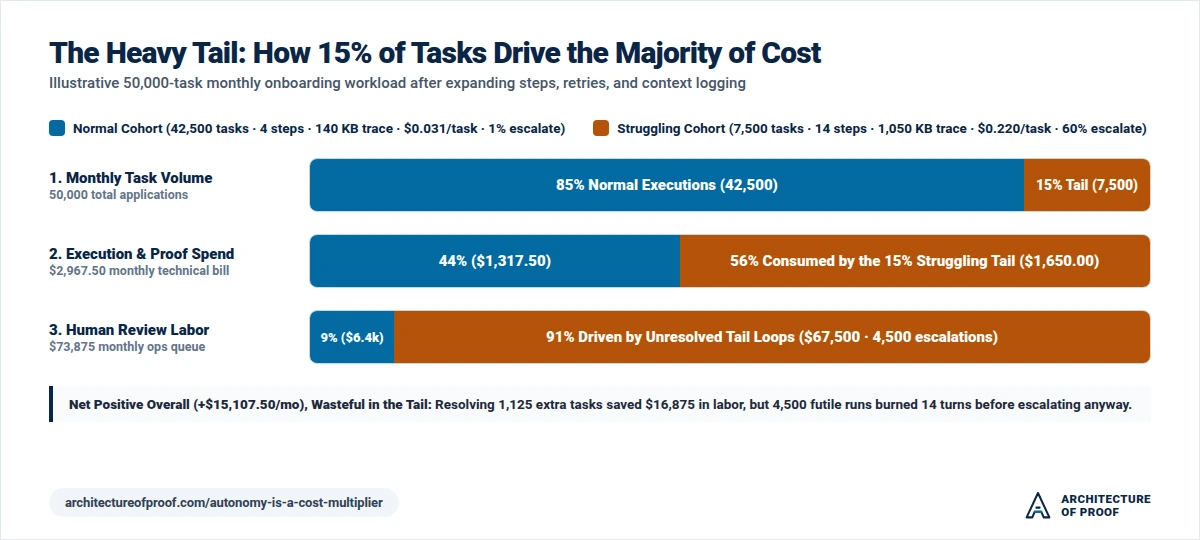
| Workload cohort | Share of task volume (50,000) | Share of technical execution & proof bill (\$2,967.50) | Share of human review labor (\$73,875) |
|---|---|---|---|
| Normal executions (42,500 tasks) | 85% | 44% (\$1,317.50) | 9% (\$6,375 · 425 escalations) |
| Complex executions (7,500 tasks) | 15% | 56% (\$1,650.00) | 91% (\$67,500 · 4,500 escalations) |
A run that loops through 14 to 20 steps of autonomous recovery and still fails release checks inflicts a double penalty: the business pays maximum inference, tool, trace, and evaluation costs during the loop, and then pays full human review labor (\$15) when the case lands in the operations queue.
Weighing the Marginal Value of Autonomy Across All Four Dimensions
Expanding an agent's autonomy pays off when the manual review labor you save is greater than the extra compute, logging, and escaped-defect cleanup you add (formal equations are in the appendix). Here is how that ledger balances for the merchant-onboarding PRD edits:
| Cost dimension | Monthly impact of PRD edits | What drove the change |
|---|---|---|
| Manual review savings | +\$16,875.00 | 1,125 fewer cases sent to the human review queue (\$15/case) |
| Added execution cost | -\$1,042.50 | 7,500 complex runs jumping from 5 steps (\$0.026) to 14 steps (\$0.165) |
| Added proof cost | -\$410.00 | Full-payload logging on normal runs (-\$42.50) plus complex-cohort traces & evals (-\$367.50) |
| Cost of escaped defects | -\$315.00 | 0.8% error rate on newly auto-approved filings (9 escaped defects at \$35 cleanup) |
| Net Monthly Value | +\$15,107.50 | Profitable overall, with 4,500 futile 14-step runs remaining to be eliminated |
The autonomy expansion paid off overall, yet 4,500 complex applications still consumed 14 steps of compute and verification before escalating anyway. That is where targeted stop rules and scoped routing can preserve the \$16,875 labor savings while trimming the wasted loops.
One Product, Four Autonomy Strategies
To isolate which architectural controls drive those savings, consider a separate B2B workflow: Vendor Contract Risk Review, processing 50,000 contracts per month (where manual legal-operations review previously took 20 minutes per contract at \$45/hour, or \$15.00 per contract).
To compare different designs with a single business metric, we use the Fully Loaded Cost per Verified Outcome (FLCVO) introduced in Part I. This metric answers a practical question: when all is said and done, what did we spend per completed contract? It adds together model compute, automated verification, human review queues, and the cost of fixing defects that slip into production, divided by the total number of completed contracts (the formal equation is in the appendix).
Rather than comparing a generous loop only against a brittle straw-man workflow, the product team evaluates four designs. Design A (Generous Non-Adaptive) gives a single frontier agent a 20-step ceiling, all 16 contract tools, full contract text in memory, and up to 3 blind reflection retries. Design B (Rigid Bounded) locks every contract into a 4-step path with 2 tools and zero retries, escalating immediately on any non-standard wording.
Between those extremes, Design A-Lite (Scoped Single-Tier) tests what basic hygiene can achieve without building a router: it keeps a single workflow with a 12-step ceiling, scopes tools by stage, logs state diffs, and allows 1 retry only on repairable API or schema errors. Finally, Design C (Risk-Adaptive) adds an upfront classifier that routes 80% of standard-template contracts (40,000) onto a fast 3-step path and routes the 20% with customized indemnity wording or third-party addenda (10,000) into a 12-step analysis path with a 5,000-token model-judge check.
In Design C, complexity triggers deeper analysis, not automatic human sign-off. The agent is authorized to approve a complex contract autonomously if its analysis verifies that liability remains capped at \$500,000 or less and standard indemnity protections hold; uncapped liability, caps above \$500,000, or unverified indemnity carve-outs require mandatory human approval.
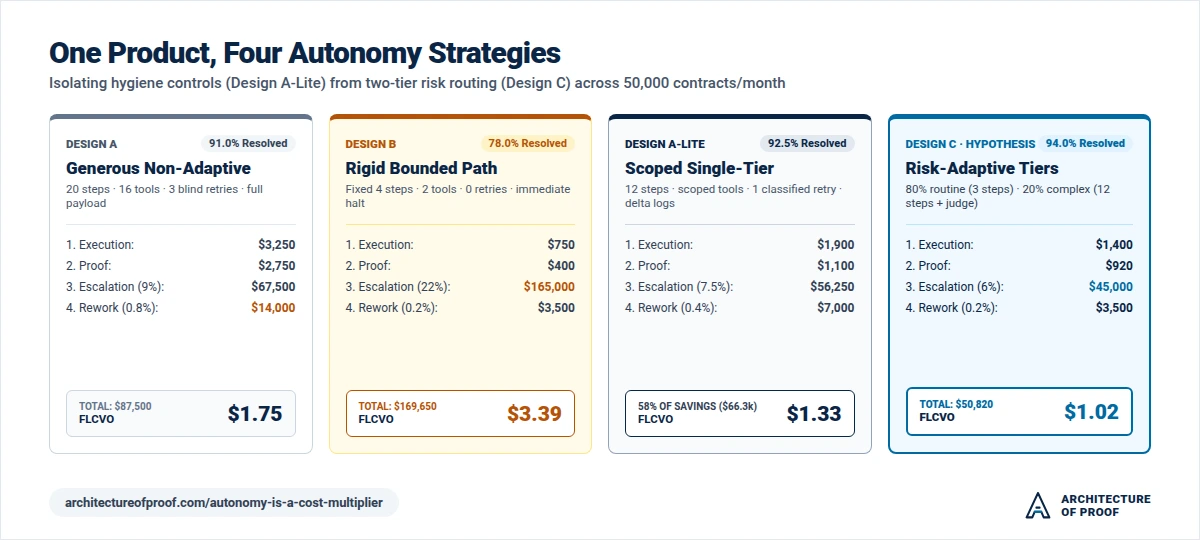
| Dimension | Design A: Generous Non-Adaptive | Design B: Rigid Bounded | Design A-Lite: Scoped Single-Tier | Design C: Risk-Adaptive (Hypothesis) |
|---|---|---|---|---|
| Step envelope (p50 / p95) | 6 / 18 steps | 3 / 4 steps | 4 / 9 steps | 3 (Routine) / 10 (Complex) |
| Autonomous verified resolution | 91.0% (45,500) | 78.0% (39,000) | 92.5% (46,250) | 94.0% (47,000) |
| Human escalation rate | 9.0% (4,500) | 22.0% (11,000) | 7.5% (3,750) | 6.0% (3,000) |
| 1. Execution cost | \$3,250 (\$0.065) | \$750 (\$0.015) | \$1,900 (\$0.038) | \$1,400 (\$0.028) |
| 2. Proof cost | \$2,750 (\$0.055) | \$400 (\$0.008) | \$1,100 (\$0.022) | \$920 (\$0.018) |
| 3. Operational recovery (\$15/case) | \$67,500 | \$165,000 | \$56,250 | \$45,000 |
| 4. Cost of escaped defects (\$35/case) | \$14,000 (0.8% / 400) | \$3,500 (0.2% / 100) | \$7,000 (0.4% / 200) | \$3,500 (0.2% / 100) |
| Total Monthly Cost (50,000 dispositions) | \$87,500 | \$169,650 | \$66,250 | \$50,820 |
| FLCVO (per completed disposition) | \$1.75 | \$3.39 | \$1.33 | \$1.02 |
Model caveats: This comparison illustrates a testable architectural hypothesis, not an empirical benchmark. Design A-Lite and Design C outperform Design A and Design B because of the modeled resolution, escalation, and defect rates; tier-by-tier numbers are in the appendix.
Attributing the Gains and Testing Sensitivity
Comparing all four designs shows where the savings come from and where the model is fragile:
- Basic hygiene (Design A-Lite) captures 58% of the total savings before you build a risk router. When a team moves from Design A (\$87,500/month) to Design A-Lite (\$66,250/month), they save \$21,250 a month (\$0.42 per contract). In this model, that gain comes from three straightforward changes: scoping tools per stage (so the agent cannot pick the wrong tool and wander off track), stopping retries on unrecoverable errors, and cutting blind retry loops from 3 retries to 1.
- Two-tier routing and targeted judge checks (Design C) capture the remaining 42% (\$15,430/month, from \$1.33 down to \$1.02). By sending the 80% of standard contracts down a 3-step path, the system trims routine compute and proof overhead, while a 5,000-token model-judge check and specialized clause tools on the 20% Complex cohort cut escaped defects in half (0.4% to 0.2%) and resolve 750 additional complex contracts autonomously.
- Router accuracy and escalation sensitivity can flip the ranking. Design C's \$0.31/contract edge over Design A-Lite depends on an accurate upfront classifier. If the classifier misroutes complex contracts into the 3-step Routine path, escaped defects rise; if overly strict judge verification pushes Complex-tier escalations from 20% to 60%, Design C's FLCVO climbs from \$1.02 to \$2.22, making Design A-Lite (\$1.33) the better choice.
- Customer workload mix can break flat SaaS pricing when the vendor staffs the review queue. Many B2B AI vendors sell managed document-processing workflows at a flat price (say, \$2.00 per contract) and staff the human-in-the-loop verification queue themselves to guarantee turnaround SLAs. Under Design C's baseline 80/20 routine-to-complex mix, a Routine contract costs the vendor \$0.45 fully loaded and a Complex contract costs \$3.28, blending to \$1.02 (a 49% gross margin at a \$2.00 price). If an enterprise customer uploads a legacy archive where 70% of contracts enter the Complex tier, the vendor's blended cost jumps to \$2.43 per contract, losing \$0.43 on every contract processed.
Decoupling Execution Budget from Decision Authority
A common mistake in agent systems is tying decision authority directly to reasoning depth. When a team builds an agent for complex, high-stakes tasks, the instinct is to grant generous execution loops so the model can inspect documents, query external APIs, and reflect on intermediate outputs. If the agent spends 15 steps and 20,000 reasoning tokens synthesizing clauses, developers assume the resulting answer is solid enough to trigger live updates, database writes, or customer actions automatically.
Computational depth does not equal organizational authority. More reasoning steps give an agent more opportunities to retrieve relevant evidence and surface latent trade-offs. They do not eliminate hallucinations, resolve conflicting business priorities, or absorb legal liability.
Consider the division of labor between a junior research analyst and an investment committee. A firm might grant an analyst three weeks, access to thousands of SEC filings, expensive database terminals, and internal financial modeling packages to dissect a corporate restructuring. The firm gives that analyst a massive execution budget. Even so, the analyst has zero authority to wire \$50 million to buy the target company's stock. The analyst's job is to prepare a thorough decision memo for human sign-off; the authority to execute the trade remains strictly with the investment committee.
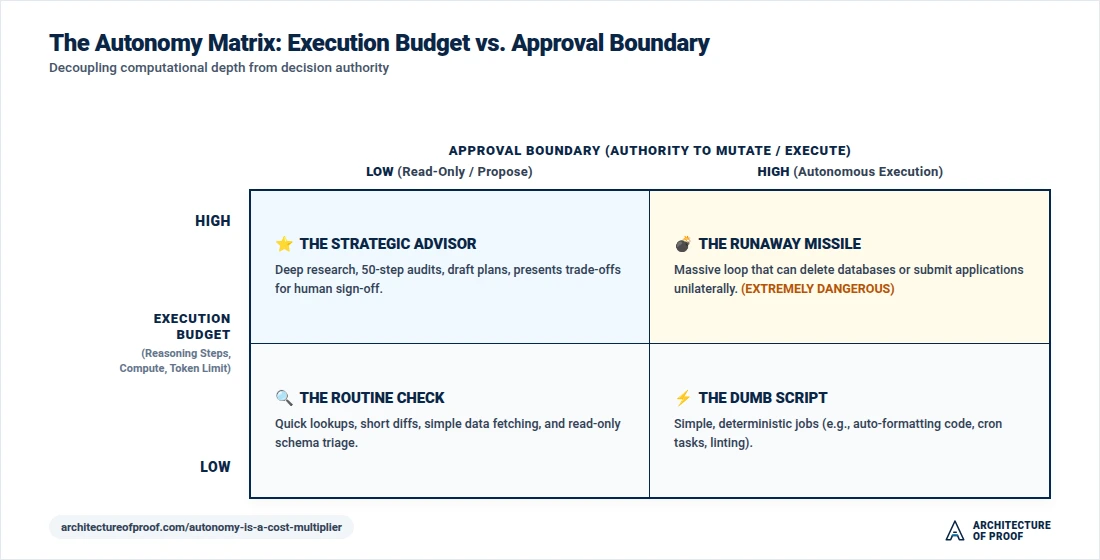
Mapping these two dimensions creates four distinct operating profiles:
- The Strategic Advisor (High Execution Budget, Low Approval Boundary): The agent runs multi-step audits, compares conflicting clauses across contracts, and synthesizes clear trade-offs. Because it has no mutation authority on external production systems, it presents its findings for explicit human authorization before any commitment occurs. This quadrant yields high operational leverage while keeping blast radius contained.
- The Runaway Missile (High Execution Budget, High Approval Boundary): The agent runs long autonomous loops with write permissions, retrying against external endpoints without human checkpoints. This quadrant is the primary driver of runaway compute and expensive manual cleanups, burning 14 or more reasoning steps only to commit an unverified defect that legal or operations teams must unwind later.
- The Routine Check (Low Execution Budget, Low Approval Boundary): The agent performs quick read-only checks, such as verifying required document fields, checking OCR readability thresholds, or validating JSON schemas. Costs stay low, and the blast radius is negligible.
- The Dumb Script (Low Execution Budget, High Approval Boundary): The agent or deterministic automation executes simple, well-defined mutations within strict bounds, such as auto-formatting pull requests, syncing calendar slots, or clearing routine approvals under pre-verified thresholds. This pattern remains safe because the actions are deterministic and easily reversible.
Two operating principles govern this boundary in production:
- Grant reasoning budgets generously for analysis. Allow the model to inspect extra source pages, run secondary cross-checks, and draft structured summaries. Compute for read-only evaluation is predictable and bounded.
- Lock irreversible state mutations behind explicit approval gates. Any operation that modifies customer records, transfers funds, dispatches external communications, or accepts contractual liabilities must halt at a hard boundary until authorized by a designated human operator or a deterministic verification check.
The PM Deliverable: The PRD Autonomy & Economic Impact Contract
To prevent autonomy settings from being improvised during sprint implementation, product managers can embed an Autonomy & Economic Impact Contract in the PRD. The contract separates execution budget (how much compute and reasoning the agent may attempt) from decision authority (what outcomes it may authorize without human sign-off):
| PRD control | Example specification (Contract Review Agent, Design C) |
|---|---|
| 1. Business outcome & target | Reduce manual legal-ops review from 100% of vendor contracts to a 6.0% target escalation rate while holding post-release clause defects below 0.25%. |
| 2. Decision authority & approval boundaries | More reasoning budget does not grant broader decision authority. Agent may auto-approve contracts whose verified liability cap is \$500,000 or less under standard indemnity rules. Uncapped liability, caps above \$500,000, or unverified indemnity carve-outs require human approval. |
| 3. Execution budget | Routine tier: max 4 steps (p50: 3 steps), 2 scoped tools, 0 retries. Complex tier: max 12 steps (p95: 10 steps), 5 scoped tools, max 1 retry. Hard timeout: 45s. |
| 4. Context & logging policy | Pass extracted structured fields and document IDs across turns; log full document text only when a Complex-tier run fails verification. |
| 5. Verification contract | Deterministic code assertions check schema and liability caps at every step; a 5,000-token model-judge checks clause interpretations in the Complex tier. |
| 6. Concrete retry & stop rules | Retry once only if a tool call returns HTTP 429/503 or a JSON schema error is repairable; halt immediately if pages are missing, scan quality is poor (below 0.85), or a retry produces the exact same validation error. |
| 7. Risk classification | Upfront classifier checks contract value, jurisdiction, and template baseline before assigning Routine vs. Complex tier. |
| 8. Economic target & queue alert ceiling | Target FLCVO of \$1.10 or less per completed contract; 6.0% target escalation rate with a 7.5% operational alert ceiling. If escalations exceed staffed capacity, defer intake or route to manual queue; never relax mandatory approval boundaries. |
| 9. Evidence & reconstructability | Routine p50: 3 spans / 45 KB. Complex p95: 10 spans / 115 KB (delta logging). Audit record stores the signed decision, policy version ID, and immutable links to retrievable source documents (e.g., 7-year retention for compliance). |
| 10. Release & rollback criteria | Fall back from Design C to Design A-Lite or widen human review if weekly post-audit defect rate exceeds 0.30% or router misclassification exceeds 2.0%. |
The Adversarial Stress-Test: Five Critical Inquiries
1. What is the strongest argument against constraining autonomy?
- The Objection: "If a 20-step agent replaces \$15 of specialist labor for \$0.22 of compute and verification, capping steps or retries to save pennies of infrastructure spend is backwards product management."
- The Practical Resolution: Wherever extra steps reliably convert a \$15 manual review into a verified resolution for \$0.22, you should fund those steps, just as our onboarding model showed a +\$15,107.50 net gain on the 1,125 recovered tasks. The target of an autonomy budget is the 4,500 wasted runs where blind retries on missing pages or broken permissions yield zero additional resolutions while multiplying compute, evaluation, and human review costs.
2. Under what circumstances does bounded routing fail?
- Open-ended discovery and synthesis workflows. An autonomous coding agent refactoring a multi-file repository or a research agent exploring scientific literature cannot be pre-routed into a 3-step template path; multi-turn exploration and backtracking are core to the product's value.
- The Practical Resolution: For open-ended workflows, replace fixed step ceilings with checkpoint gates (requiring automated test-suite passage or user confirmation after every 5 turns or a set spend threshold) and align pricing with compute consumption rather than flat per-task fees.
3. What would a skeptical engineering lead object to?
- The Objection: "Building upfront risk classifiers, custom logging, and tiered verification takes weeks of engineering capacity that could go toward core features."
- The Practical Resolution: That is why teams should implement Design A-Lite first. Scoping tools by stage, classifying retry errors, and logging state diffs require minimal architectural work and capture 58% of the modeled savings before any two-tier router is built.
4. Which alternative deserves consideration?
- High runtime autonomy paired with tail-sampled logging. When a team lets the agent run freely and records full traces only on errors, high-latency runs, or escalations, they cut telemetry storage bills on low-risk workflows (covered in Part IV). However, tail sampling only lowers recording costs after execution; it does not prevent futile retry loops from burning inference, tool calls, and human review labor.
5. What am I assuming that may not be true?
- That the upfront classifier gets every call right. If a lightweight classifier misroutes a contract with a subtle indemnity modification into the shallow Routine path, the bounded workflow can miss a risk that a broader reasoning loop might have caught. Tiered architectures require continuous audit sampling of Routine approvals to measure classifier accuracy.
One-Line Synthesis
Autonomy is neither automatically wasteful nor automatically cheap. Its product value comes from giving an agent extra steps and tools where they actually solve customer problems, while cutting off blind retries that waste compute and still land on a human's desk.
Join the Discussion: Share your team's experience, ask questions, or join the practitioner commentary on this monograph on LinkedIn.
Appendix: Economic Equations & Model Arithmetic
1. Core Unit-Economics Equations
Net Value of Added Autonomy:
$$ \begin{aligned} \text{Net Value of Added Autonomy} &= \text{Review Labor Saved (Fewer Manual Cases)} \\ &\quad - \left( \text{Added Execution} + \text{Added Proof} + \text{Cost of Escaped Defects} \right) \end{aligned} $$
Fully Loaded Cost per Verified Outcome (FLCVO):
$$ \text{FLCVO} = \frac{\text{Execution} + \text{Proof} + \text{Human Review} + \text{Defect Cleanup}}{\text{Completed Contracts}} $$
2. Cumulative Context Exposure vs. Recorded Trace Volume
When an agent executes $N$ turns carrying forward a base prompt and tool header $H$ plus an incremental per-turn observation $D$, cumulative model input grows quadratically:
$$ \begin{aligned} C_{\text{model_exposure}}(N) &= \sum_{k=1}^{N} \left( H + k \cdot D \right) \\ &= N \cdot H + \frac{N(N+1)}{2} \cdot D \end{aligned} $$
Using $H = 15\text{ KB}$, $D = 8\text{ KB}$, and metadata $M_{\text{meta}} = 2\text{ KB}$ per turn across all scenarios:
- Reference and delta logging (storing $H$ once and logging $D + M_{\text{meta}} = 10\text{ KB}$ per turn) scales linearly: $45\text{ KB}$ at 3 turns, $55\text{ KB}$ at 4 turns, $65\text{ KB}$ at 5 turns, $115\text{ KB}$ at 10 turns, and $155\text{ KB}$ at 14 turns.
- Full-payload span logging ($V_{\text{full}}(N) = C_{\text{model_exposure}}(N)$) scales quadratically:
- At 4 turns: $(4 \times 15\text{ KB}) + (10 \times 8\text{ KB}) = 140\text{ KB}$.
- At 14 turns: $(14 \times 15\text{ KB}) + (105 \times 8\text{ KB}) = 210\text{ KB} + 840\text{ KB} = 1,050\text{ KB}$.
3. Merchant-Onboarding Model Breakdown (50,000 Applications/Month)
Volume is split into 85% Normal (42,500 applications) and 15% Complex (7,500 applications), with human review at \$15.00 per escalated case and post-release defect remediation at \$35.00 per case:
| Cohort & stage | Avg steps & trace | Technical cost / task | Monthly technical bill | Escalations & human review (\$15/case) |
|---|---|---|---|---|
| Normal (42,500) · Before | 4 steps · 55 KB | \$0.030 (\$0.025 exec + \$0.005 proof) | \$1,275.00 | 1.0% (425 cases) = \$6,375 |
| Complex (7,500) · Before | 5 steps · 65 KB | \$0.032 (\$0.026 exec + \$0.006 proof) | \$240.00 | 75.0% (5,625 cases) = \$84,375 |
| Total Baseline (Before) | 56.5 KB avg | \$0.0303 avg | \$1,515.00 | 12.1% (6,050 cases) = \$90,750 |
| Normal (42,500) · After | 4 steps · 140 KB | \$0.031 (\$0.025 exec + \$0.006 proof) | \$1,317.50 (44.4%) | 1.0% (425 cases) = \$6,375 (8.6%) |
| Complex (7,500) · After | 14 steps · 1,050 KB | \$0.220 (\$0.165 exec + \$0.055 proof) | \$1,650.00 (55.6%) | 60.0% (4,500 cases) = \$67,500 (91.4%) |
| Total Post-Edit (After) | 276.5 KB avg (4.9x) | \$0.0594 avg | \$2,967.50 (+\$1,452.50) | 9.85% (4,925 cases) = \$73,875 (-\$16,875) |
Subtracting the \$1,452.50 in added technical spend and \$315.00 in added remediation (0.8% defect rate on 1,125 newly auto-approved filings $= 9 \times \$35$) from the \$16,875.00 in saved human review yields the +\$15,107.50 net monthly gain.
4. Vendor Contract Review Tier Breakdown (Design C, 50,000 Contracts/Month)
Design C routes 80% of contracts into the Routine tier and 20% into the Complex tier:
| Design C tier | Monthly volume | Execution cost | Proof cost | Human review (\$15/case) | Escaped defect cleanup (\$35/case) | Tier total & unit cost |
|---|---|---|---|---|---|---|
| Routine tier (80%) | 40,000 | \$600 (\$0.015) | \$320 (\$0.008) | \$15,000 (2.5% / 1,000) | \$2,100 (0.15% / 60) | \$18,020 (\$0.4505/contract) |
| Complex tier (20%) | 10,000 | \$800 (\$0.080) | \$600 (\$0.060) | \$30,000 (20.0% / 2,000) | \$1,400 (0.40% / 40) | \$32,800 (\$3.2800/contract) |
| Combined Baseline (80/20) | 50,000 | \$1,400 | \$920 | \$45,000 (6.0% / 3,000) | \$3,500 (0.20% / 100) | \$50,820 (\$1.02 FLCVO) |
When a customer uploads a 30% Routine / 70% Complex mix, the vendor's blended cost per contract is $(0.30 \times \$0.4505) + (0.70 \times \$3.2800) = \$0.135 + \$2.296 = \mathbf{\$2.43}$.
Sourcing & Verification Ledger
Evidence tags: [E] published primary engineering benchmark, [I] author assumption or illustrative scenario model, [V] mathematical identity verified.
| Claim | Tag | Source and caveat |
|---|---|---|
| Single-agent loops use ~4x more tokens than a direct single-pass call; multi-agent systems use ~15x more tokens | [E] | Anthropic Engineering, "How we built our multi-agent research system" (2025). Anthropic's benchmark compares tool loops against standard chat (single-pass prompt-and-response interactions without tools). Measured on production research workloads; ratios vary by task structure and caching. |
| The Autonomy Matrix (Execution Budget vs. Approval Boundary) | [I] | Original architectural framework developed for this series decoupling cognitive depth (steps, compute) from decision authority (mutation rights, blast radius). |
| Merchant-onboarding model (87.9% to 90.2% completion, +\$15,107.50 net gain, 4.9x trace volume, 6.9x complex-cohort tech spend) | [I] | Illustrative model across 42,500 normal and 7,500 complex tasks before and after PRD edits using $H=15\text{ KB}$ and $D=8\text{ KB}$. Demonstrates interaction mechanics, not an empirical benchmark. |
| Four Cost Dimensions of Autonomy (Execution, Proof, Operational, Accountability) | [I] | Product-economics framework developed for this series. |
| Quadratic context exposure ($N \cdot H + \frac{N(N+1)}{2}D$) vs. linear delta trace volume | [V] | Exact arithmetic sum for un-truncated turn history ($140\text{ KB}$ at $N=4$, $1,050\text{ KB}$ at $N=14$) vs. reference/diff span logging ($55\text{ KB}$ at $N=4$, $65\text{ KB}$ at $N=5$). |
| Four-strategy vendor contract review model (\$1.75 vs. \$3.39 vs. \$1.33 vs. \$1.02 FLCVO, and \$2.43 70%-complex case) | [I] | Illustrative hypothesis across 50,000 monthly dispositions separating single-tier hygiene controls (Design A-Lite) from two-tier risk routing (Design C). |
| PRD Autonomy & Economic Impact Contract | [I] | Operational specification template separating execution budgets from approval authority. |
Subscribe to the Architecture of Proof Dispatch
Rigorous, decision-forcing systems engineering and AI governance monographs for technical leaders. Delivered periodically, zero spam.