The Telemetry-to-Eval Flywheel, Part 1: Signal Discovery, Feasibility, and Enterprise Data Contracts
A Systems Product Blueprint for AI Product Managers, Engineering Leads, and Evaluation Architects
Part of the Telemetry-to-Eval Flywheel Series:
- Part 1: Signal Discovery, Feasibility, and Enterprise Data Contracts (Current Post)
- Part 2: Architectural Isolation, Prioritization, and Boundary Mapping
- Part 3: Tiered CI/CD Portfolios, Anti-Gaming, and the Minimum Viable Loop
An AI product's defensible asset is its accumulated operational memory: knowing precisely where internal reasoning breaks under production load, what failure costs the business, and how to programmatically encode that knowledge into CI/CD invariants before users run into the defect a second time.
The most vulnerable interval for an applied AI system begins on deployment day.
In staging, evaluation suites present an illusion of control. Teams spend weeks curating golden prompts, red-teaming obvious failure modes, and benchmarking accuracy. The test harness returns a clean 94% pass rate, CI turns green, and leadership authorizes release.
Then production traffic hits.
Real user behavior bears little resemblance to pre-deployment test benches. Operators paste malformed tables from legacy enterprise software, submit document scans with warped margins, and repeatedly click submit when inference queues back up. More damagingly, an operator will review an AI draft, delete three non-obvious hallucinated numbers, and manually paste the edited text into an external email without filing a bug report.
When unhandled defects surface, teams reflexively play Prompt Whack-a-Mole. A high-value customer complains about a bad extraction, an engineer tweaks a few sentences in the system prompt, verifies two edge cases by hand, and deploys. Forty-eight hours later, that localized prompt edit silently breaks extraction accuracy across three unrelated tenant accounts.
Teams that break this regression cycle build a structured Telemetry-to-Eval Flywheel: an observability pipeline that captures production friction, isolates the underlying reasoning failure, and commits automated regression assertions before users run into the bug again.
The Boundary of Applicability (Scope Statement): This framework is built for bounded, instrumentable enterprise workflows where teams can reconstruct system state, obtain authoritative ground truth, and safely inspect minimum evidence under data governance contracts (e.g., contract clause extraction, invoice processing, claim adjudication, policy triage, structured database routing).
It is not a silver bullet for collaborative, political, or creative workflows (such as executive strategy drafting, sales-account planning, or multi-month organizational design) where the ultimate outcome occurs offline in meetings and spreadsheets, ground truth is delayed or contested, and downstream behavior is invisible to software telemetry.
Why Do Pre-Launch Evaluation Suites Decay in Production?
The decay of offline evaluation sets is not an accident of poor data engineering; it is a structural property of non-deterministic systems operating in open enterprise environments.
To diagnose why pre-launch evals decay, product leaders must separate three distinct layers of system health that are too often conflated:
| System Health Layer | The Operational Question | Core Metrics & Telemetry Signals | Structural Decoupling |
|---|---|---|---|
| 1. Operational Health (APM) | "Is the service running?" | Uptime, P95/P99 latency, 500-error rates, token generation throughput. | Operational health $\ne$ Semantic health. Green dashboards routinely mask broken logic. |
| 2. Semantic Health (Evals) | "Is the system producing the intended output?" | Groundedness, citation accuracy, extraction precision, schema conformance. | Semantic health $\ne$ Business outcome. A perfect generation can fail customer workflow needs. |
| 3. Business Outcome (Reality) | "Did the customer accomplish their job?" | Workflow completion, decision velocity, net economic value realized. | True ground truth arrives downstream; unobservable in isolated model traces. |
- Application Performance Monitoring (APM) measures operational health: server uptime, GPU memory usage, token generation speed, and HTTP status codes.
- Evaluation Harnesses measure semantic health: whether the model’s generation conforms to schemas, grounds its claims in retrieved context, and respects safety bounds.
- Product Telemetry measures business outcomes: whether the user actually accepted the recommendation, completed their task, and realized economic value.
In traditional software, unhandled edge cases emit stack traces, database rollbacks, or 500 errors. In probabilistic systems, failure is almost always syntactically valid. The model returns a fluent, grammatically clean paragraph that is factually wrong or commercially non-viable.
Because the service emitted a 200 OK, APM dashboards flash green while customer trust quietly erodes. Offline benchmarks rot because they reflect the exact input distribution engineers anticipated during development, leaving messy real-world variations unrepresented.
The PM's Executive Alignment Tool: What Telemetry Actually Means
When presenting AI product dashboards to leadership, product managers frequently face well-meaning executive assumptions that confuse operational activity with verified business value. Use this alignment matrix to clarify what telemetry actually proves:
| Telemetry Signal on Your Dashboard | What Leadership Reflexively Assumes | The Operational Reality Behind the Numbers | What You Can Defensibly Report |
|---|---|---|---|
| High copy-to-clipboard rate (95%+) | "Users love the output and are using it everywhere." | Users copy text out to private editors (Word, Excel) to hand-fix hallucinated figures or delete bad clauses. | "Copy activity is high, but we cannot claim output accuracy without tracking what users edit before sending." |
| Zero re-prompts or negative words | "The model got it right on the very first try." | The user realized the model didn't understand, gave up arguing with the prompt, and did the work manually. | "Prompt thrashing is low. However, low re-prompt rates can signal user abandonment just as easily as user satisfaction." |
| Zero bug tickets filed in Jira / Zendesk | "The system has an ultra-low defect rate in production." | Busy professionals take 5 seconds to hand-edit errors, while filing an IT ticket takes 5 minutes off the clock. | "Operational uptime is stable. We cannot claim zero defects without conducting proactive expert audits." |
| Fast P95 latency (< 1.2s) | "Fast speed proves the AI is saving employee labor." | Returning a wrong or hallucinated answer quickly does not save time if an expert must re-read the original file. | "Inference latency meets SLA. Business labor savings depend on human review time, not GPU speed." |
When dashboards cannot detect semantic breakdown, teams naturally turn to production telemetry to catch failures. But before allocating engineering sprints to telemetry pipelines, product leaders need a feasibility check: can your product actually observe downstream reality?
The Observability Feasibility Gate: Can Telemetry Actually Guide You?
Before investing in telemetry pipelines to discover missing evaluation cases, product leaders must apply an explicit Observability Feasibility Gate. If an application fails these criteria, telemetry cannot serve as a reliable discovery engine, and teams must instead rely primarily on pre-deployment hazard analysis and credentialed expert audits.
The gate tests five operational dimensions:
1. Workflow Capture: Observing Downstream Action
An isolated inference call carries no intrinsic business meaning; user action determines outcome. Telemetry functions as a discovery engine only when client software instruments what happens next. In high-feasibility systems, client applications measure character-level edit distance ($L_{\text{edit}}$) between model output and final saved state, record database status transitions (such as an invoice moving from Pending Review to Disputed), and log immutable transactional commitments (POST /v1/settlements).
The gate fails when workflows air-gap. If a financial analyst copies a model's quarterly summary, switches windows into Microsoft Excel to rebuild the valuation model, and emails the spreadsheet directly to an executive committee, the AI platform logs a clean 200 OK while remaining totally blind to downstream utility or silent manual corrections.
2. Outcome Lag: The Ground Truth Horizon
The telemetry loop requires ground truth to arrive before model weights or prompts drift. In invoice reconciliation or customer ticket routing, payment confirmations or customer re-open events arrive within 24 to 48 hours, creating a tight feedback loop for weekly evaluation updates.
Conversely, in litigation risk assessment, credit underwriting, or pharmaceutical research, verifying whether an inference was correct may require 18 months of litigation, loan repayment history, or laboratory validation. When ground truth lags by multiple quarters, operational telemetry cannot drive sprint-level CI/CD updates.
3. Attribution Clarity: Isolating the Model's Causal Footprint
Telemetry must isolate the model's exact contribution to task completion. Bounded tasks—such as extracting ten structured metadata fields from a bill of lading where an operator overrides two values—provide unambiguous causal attribution.
Attribution collapses in open-ended collaborative workspaces. When three risk analysts spend two weeks editing an AI-assisted compliance memo, injecting proprietary internal policy data and rewriting paragraphs, isolating whether a final regulatory rejection stemmed from the model's baseline retrieval or the human analysts' subsequent adjustments becomes impossible.
4. State Auditability: Reconstructing Runtime Invariants
Replaying an operational anomaly requires freezing the complete execution environment. High-feasibility platforms log versioned system prompts, deterministic model temperatures (often $T = 0$), exact retrieved vector chunk IDs with cosine similarity scores, and serial tool payloads.
Auditability breaks when systems query non-deterministic live web indices or external third-party APIs that mutate minute-by-minute. When the upstream environment is ephemeral, engineers cannot reproduce the failure state or verify whether a proposed fix cures the defect.
5. Privacy Viability: Operating Under Data Governance Constraints
Finally, enterprise legal agreements dictate whether telemetry can be retained, inspected, and transformed. Viable architectures negotiate customer data contracts permitting tenant-isolated storage, zero-retention boundary policies, and programmatic PII scrubbing before triage.
In regulated healthcare (HIPAA) or European banking (GDPR Article 9), contracts frequently prohibit retaining prompt text, tracking clipboard diffs, or granting vendor engineers inspection rights over production traces. In these environments, raw telemetry mining is legally non-viable.
Observability Feasibility Summary
| Feasibility Dimension | The Operational Question | High Feasibility (Telemetry Works) | Low Feasibility (Rely on Audits / Hazards) |
|---|---|---|---|
| 1. Workflow Capture | Can the product observe downstream actions in-app? | Instrumented diffs ($L_{\text{edit}}$), state changes, API commitments. | User moves work into offline spreadsheets, email, or meetings. |
| 2. Outcome Lag | How quickly does ground truth arrive? | Hours to days (reopened tickets, payment clears). | Multi-quarter lag (M&A advice, litigation outcomes). |
| 3. Attribution Clarity | Can you isolate the model's specific causal impact? | Single-task extraction, automated tool invocation. | Multi-author collaborative docs, complex team deliberations. |
| 4. State Auditability | Can you reconstruct the prompt, context, and environment? | Versioned prompts, pinned context chunks, logged tool states. | Ephemeral external APIs, dynamic live web data. |
| 5. Privacy Viability | Does the enterprise contract permit trace inspection? | Tenant-isolated storage with automated PII redaction. | Customer prohibits retention, inspection, or trace logging. |
When an application clears this gate, production telemetry becomes an effective discovery vector. When it fails, teams must rely primarily on hazard-based pre-specification and structured expert audit panels.
The Selection Bias Trap: Why Telemetry Cannot Stand Alone
A foundational error in AI product management is confusing observable telemetry with system reliability.
Telemetry captures only observable friction within the instrumented boundary of your software. But in enterprise systems:
$$\text{Observed Failures} \neq \text{Total Failures}$$
The Signal-to-Failure Capture Ratio measures the proportion of actual system failures that manifest as detectable telemetry friction:
$$\text{Signal-to-Failure Capture Ratio} = P(\text{Signal} \mid \text{Failure}) = \frac{\text{Observable Friction Events}}{\text{Total Latent & Externalized Defects}}$$
In high-stakes enterprise domains, this ratio is dangerously low:
$$P(\text{Signal} \mid \text{Failure}) \ll 1$$
The catastrophic failure is frequently the one that emits zero behavioral signal:
- An analyst accepts a plausible but fabricated financial figure and includes it in an SEC filing.
- A clinician trusts an erroneous drug interaction summary because the tone was authoritative.
- A compliance officer reviews an AI-generated audit memo that omitted a critical sanction update, never realizing it was missing.
Because the user trusted the output, they did not re-prompt, did not edit the clipboard, and did not escalate to human support. If a product team relies exclusively on telemetry to discover what to evaluate, they will systematically optimize the product for visible user annoyance while remaining blind to catastrophic silent errors.
The Plural Evidence Architecture (The Assurance Triad)
To eliminate this selection bias, mature AI organizations embed telemetry within a Plural Evidence Architecture consisting of three complementary learning loops:
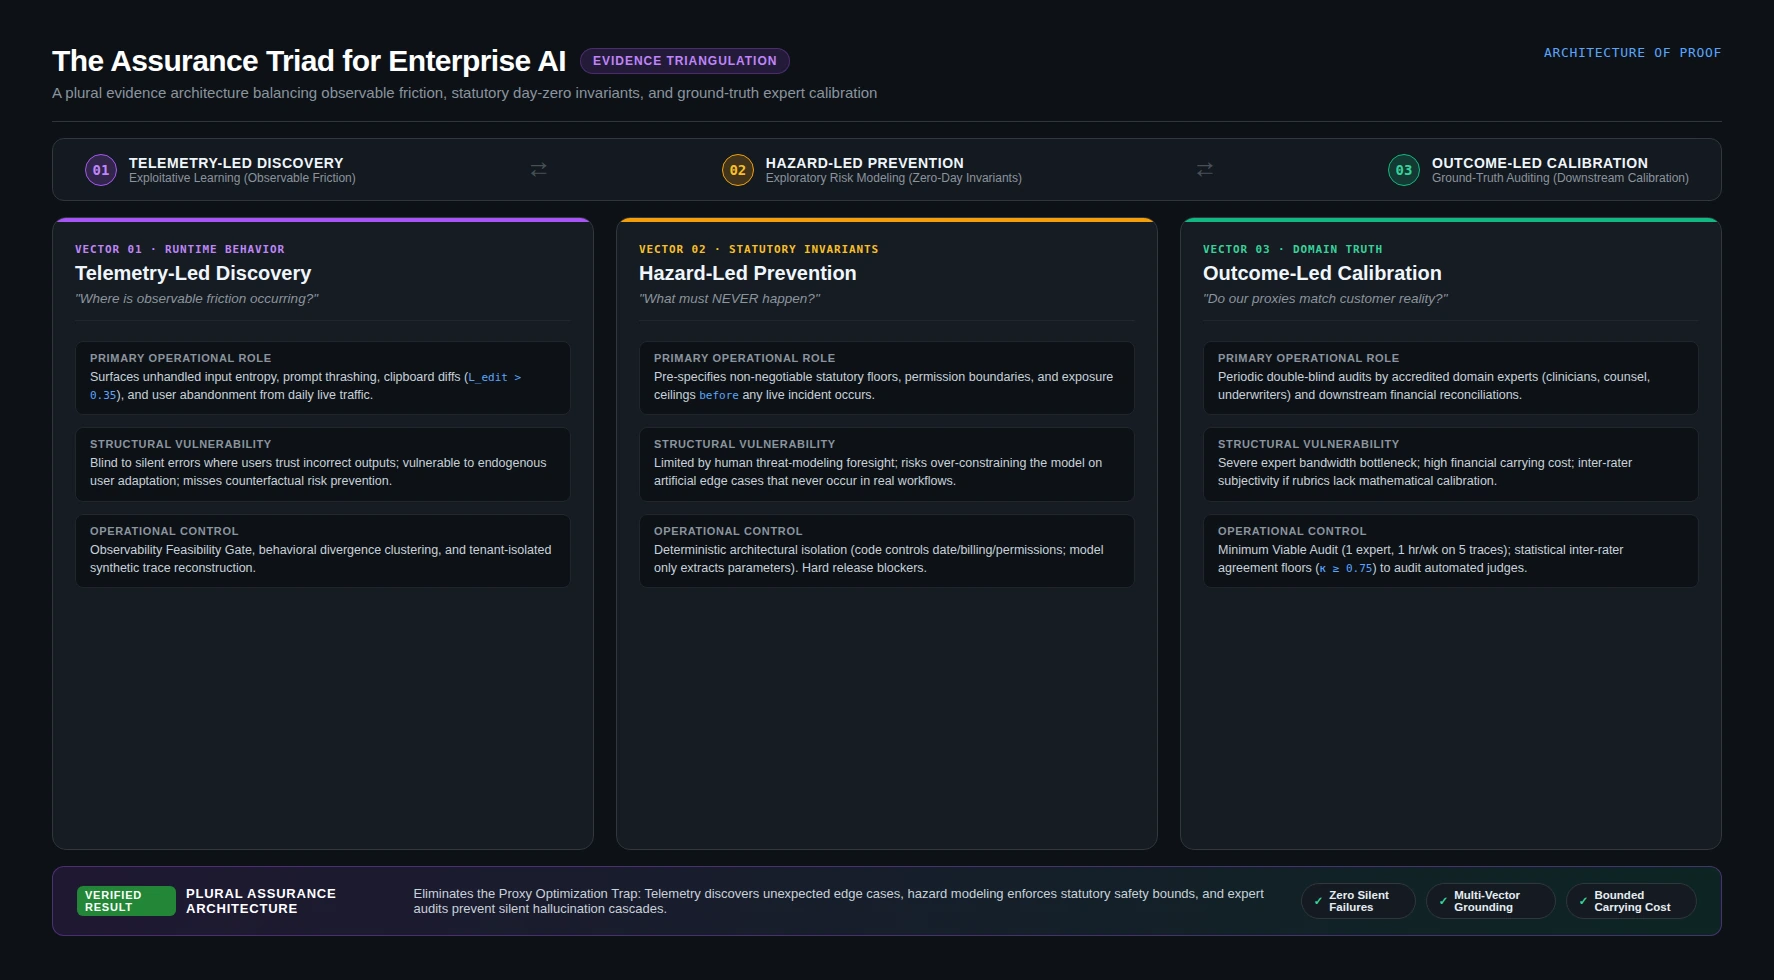
- Telemetry-Led Discovery (Observational Friction): Mines production interaction spans to isolate where operators encounter workflow resistance, execute manual clipboard corrections, or abandon sessions.
- Hazard-Led Prevention (Deterministic Safety Envelopes): Pre-specifies non-negotiable safety and compliance boundaries—such as unauthorized ledger commits, cross-tenant leakage, or unverified medical dosages—through deterministic code assertions prior to release.
- Outcome-Led Calibration (Forensic Audit Sampling): Deploys credentialed human domain experts to audit randomized samples of 'successful' interactions, specifically targeting silent, confident-sounding hallucinations that trigger no user friction.
Privacy-First Telemetry: The Rules of the Road
When proposing a telemetry-to-eval loop to an enterprise customer or corporate security council, the immediate objection is commercial and legal:
"You are proposing to inspect my employees' prompts, corporate documents, and workflow behavior. Who owns that data? Does it cross tenant boundaries? How do we prevent trade secrets from leaking into your shared test suite?"
A product team cannot operate a telemetry flywheel without a formal Telemetry Data Contract:
| Data Contract Principle | Operational Mandate | Enterprise Implementation Mechanism |
|---|---|---|
| 1. Bounded Capture | Structural metadata only | Ingest interaction spans, latency, and status codes; scrub payload body fields at the ingestion boundary. |
| 2. Edge Redaction | Zero raw PII retention | Strip client identifiers, credentials, and sensitive tokens prior to telemetry persistence. |
| 3. Tenant Isolation | Cryptographic data silos | Store traces within tenant-isolated infrastructure; prevent cross-tenant data pooling. |
| 4. Synthetic Promotion | Zero customer text in tests | Customer text never enters shared golden suites; extract the abstract failure topology (the structural reasoning defect) into synthetic cases. |
| 5. Auditable Deletion | Enforced retention TTLs | Maintain customer-controlled 30-day retention policies with programmatic tenant purge APIs. |
By guaranteeing that production traces never become shared test assets without synthetic de-identification and structural abstraction, the organization protects customer sovereignty while preserving the architectural learning loop.
How to Build Test Cases Without Keeping Customer Data
Every AI product manager eventually runs into a standoff between Engineering and Legal:
- Engineering says: "I can’t fix this bug or write a test unless I can see the customer's exact prompt and document."
- Legal and Enterprise Security say: "You are legally forbidden from saving customer data or copying their text into our test suite."
Reconciling engineering needs with compliance mandates requires a formal boundary rule: extract the abstract logic defect into synthetic fixtures, while immediately dropping raw customer artifacts at the ingestion gate.
| Step | What Happens | What You Keep | What You Trash |
|---|---|---|---|
| 1. Log the system path, not the text | Save the technical metadata (which tools ran, schema failures, error codes) while scrubbing names and raw text at the ingestion door. | System state and execution path. | Customer names, proprietary documents, and financial data. |
| 2. Identify the pattern of the bug | An engineer looks at the scrubbed trace to spot what kind of reasoning mistake happened (e.g., "The model got confused when a cancellation date crossed into a new month"). | The abstract bug pattern (failure topology). | The customer's actual contract. |
| 3. Generate a fictional clone | Have an LLM generate a 100% made-up scenario (fake company, fake dates, fictional amounts) that triggers that exact same logic flaw. | A reproducible test case. | Any legal or privacy liability. |
| 4. Lock the fake case into your test suite | Commit the fictional test case into your automated CI/CD pipeline so the model is permanently blocked from making that mistake again. | Permanent product protection. | Customer exposure risks. |
The durable asset is the underlying topological pattern of the defect. A date-calculation boundary error in a hospital invoice shares the exact structural failure mechanics as one in a commercial loan schedule. Capturing that abstract pattern yields a reusable regression fixture; customer artifacts remain isolated within their security perimeter.
Telemetry as a Hypothesis Generator: Beyond Naive Labeling
In traditional distributed systems, operational health and functional correctness are tightly linked: corrupted records trigger database rollbacks, memory leaks throw OOM panics, and unhandled exceptions emit HTTP 500 errors.
Generative architectures break this coupling. A model that hallucinates an invalid indemnification clause or transposes two accounting periods still returns a syntactically spotless 200 OK in 750 milliseconds. Because the runtime cannot identify semantic degradation internally, product teams must instrument observable friction: behavioral traces indicating that an operator had to fight, correct, or bypass the generated output.
Defining Observable Friction
Observable friction represents any instrumented client-side behavior demonstrating that generated output failed user requirements. Primary indicators include prompt reformulation with negative constraints, high character edit distance on saved drafts, and session abandonment followed by human ticket escalation.
Downstream telemetry provides an operational hypothesis regarding failure locations, but behavioral data alone never proves root cause.
Decoding Behavioral Telemetry: The Four Core Friction Signals
To identify where models break under production load, platforms instrument four high-signal behavioral markers:
1. Prompt Reformulation: Thrashing vs. Exploration
A second prompt submitted within 60 seconds does not inherently signal failure. An operator requesting to "format this summary as three markdown columns" is progressing through a task. True thrashing manifests when follow-up submissions exhibit high token overlap with preceding turns while introducing negative syntactic constraints ("no", "do not include", "I already specified"). When negative qualifiers spike across turns, client telemetry flags active user error correction and a probable reasoning failure.
2. Clipboard Survival: The Edit-Distance Trap
Interpreting edit distance ($L_{\text{edit}}$, normalized Levenshtein or token diff between model output and final committed record) requires nuance. Zero edit distance often signals passive operator rubber-stamping rather than perfection—especially in high-volume, repetitive back-office workflows.
The highest-yield diagnostic signal occurs in moderate modification regimes ($0.15 \le L_{\text{edit}} \le 0.40$), where an operator preserves overall syntactic structure but surgically overwrites specific dates, numerical amounts, or statutory citations. That differential vector $(Y' - Y)$ isolates the precise semantic defect for expert triage.
3. Session Abandonment and Latency Budgets
When a client fires an HTTP 499 (client closed request) or navigates away while tokens are actively streaming, the model has breached the operator's workflow latency budget. An answer that scores 99% factual precision after a 28-second multi-step reasoning trace is an operational failure if human task switching occurs at second 6.
4. Channel-Hop Escalations
When an automated agent session is followed within 30 minutes by an inbound support ticket, CRM dispute, or manual queue reassignment, telemetry captures the highest-confidence negative signal available. The entire preceding agent trace—including intermediate tool calls and failed recovery loops—becomes a primary candidate for failure diagnosis.
The Hypothesis-to-Eval Pipeline: The Six Validation Stages
Detecting a friction spike does not tell you how to fix the system; it merely surfaces an unverified hypothesis.
Transforming an operational anomaly into a durable CI/CD test requires a six-stage validation ladder from statistical signal to verified regression invariant. Teams that skip stages fall into the Instant-Patch Trap: panicking over an anomaly, rewriting system prompts on a guess, and quietly breaking functionality for other accounts.
flowchart LR
    S1["1. Raw Signal<br/>(Statistical Noise)"] --> S2["2. Suspicion<br/>(Friction Triage)"]
    S2 --> S3["3. Investigation<br/>(Intent Adjudication)"]
    S3 --> S4["4. Failure Hypothesis<br/>(Root Cause Isolation)"]
    S4 --> S5["5. Ground Truth<br/>(Expert Calibration)"]
    S5 --> S6["6. Durable Eval<br/>(Permanent CI/CD Asset)"]
| Validation Stage | Primary Owner (RACI) | Operational Investigation Vector | Concrete Production Evidence |
|---|---|---|---|
| 1. Raw Signal | Data Eng / Telemetry Monitors | Anomaly detection trigger | Automated monitor flags increased edit distance ($L_{\text{edit}} > 0.35$) or a prompt thrashing spike. |
| 2. Suspicion | Product Manager / Ops Triage | Friction triage | Triage decision: "Session span 8492 flagged for investigation due to anomalous repeat submissions." |
| 3. Investigation | Product Manager & System Analyst | Intent adjudication | Human review of user intent: "Did the model fail, or did the customer revise their own workflow goal?" |
| 4. Failure Hypothesis | AI / Prompt Engineer | Root cause isolation | Abstracting the defect: "The model fails when cancellation dates cross monthly accounting boundaries." |
| 5. Ground Truth | Domain Expert / SME (Legal, CPA, MD) | Expert calibration | Authoritative policy definition: Credentialed specialist defines the non-negotiable statutory invariant. |
| 6. Durable Eval | QA / Evaluation Architect | Regression asset | Permanent protection: Parametric synthetic test suite committed to the versioned CI/CD test harness. |
The Serial Progression: Why Skipping Stages Breaks Systems
Each stage in this pipeline answers a distinct question of certainty (how sure are we, and what is the ground truth?). Because each step provides prerequisite evidence for the next, stages must be executed serially:
- Stage 1 (Raw Signal) $\rightarrow$ Stage 2 (Suspicion): Automated monitors detect statistical outliers across thousands of daily sessions. During triage, the PM confirms that the event warrants human investigation rather than being background network jitter or one-off noise.
- Stage 2 (Suspicion) $\rightarrow$ Stage 3 (Investigation): The team adjudicates user intent. Before diagnosing model code, you must determine whether the user was fighting a model defect or simply exploring and revising their own goals (e.g., changing currency midway). Skipping this stage wastes engineering cycles trying to "fix" models for users who simply changed their minds.
- Stage 3 (Investigation) $\rightarrow$ Stage 4 (Failure Hypothesis): Once a defect is confirmed, the team abstracts the logical shape of the bug away from literal customer words. Skipping this stage leads back to Prompt Whack-a-Mole: patching the customer's specific phrasing rather than fixing the underlying reasoning failure.
- Stage 4 (Failure Hypothesis) $\rightarrow$ Stage 5 (Ground Truth): Engineers do not define business law or accounting rules. A credentialed domain expert (e.g., licensed attorney, CPA, or medical clinician) must authoritatively specify the required invariant. Skipping this stage allows engineers to encode their own subjective guesses into the system as ground truth.
- Stage 5 (Ground Truth) $\rightarrow$ Stage 6 (Durable Eval): The validated invariant is encoded into a synthetic fixture and committed into the automated CI/CD pipeline, preventing regressions without storing customer PII.
The PM's Operational Health Metric: Telemetry Signal Precision
When operating this triage loop, the product manager's primary dashboard metric is not raw anomaly volume, but Telemetry Signal Precision:
$$\text{Telemetry Signal Precision} = \frac{\text{Triaged Behavioral Signals Yielding Validated Invariants or Controls}}{\text{Total Flagged Friction Anomalies Investigated}}$$
This ratio answers the critical operational question: Is our telemetry pipeline actually generating durable product assets, or is it burning engineering hours on false alarms?
- Precision < 15% (Alert Fatigue): Your anomaly monitors are overly sensitive or conflating creative multi-turn exploration with prompt thrashing. Triage engineers spend 85% of their time reviewing false alarms.
- Precision > 60% (Under-Monitoring): Your alert thresholds are likely too conservative, capturing only extreme user meltdowns while missing subtle workflow friction and semantic drift.
- Target Benchmark (25%–45% Precision): A sustainable, high-yield telemetry loop regularly converts 1 out of every 3 investigated anomalies into durable CI/CD invariants or deterministic platform controls without burning out the triage team.
The Adversarial Stress-Test: Five Critical Inquiries
To ensure this observability framework withstands enterprise skepticism and technical stress, we subject telemetry-led evaluation discovery to five decision-forcing inquiries:
1. What is the strongest argument against this approach?
- The Selection Bias Trap: Telemetry only catches mistakes that bother the user. In high-stakes work, the most dangerous errors are completely silent: the AI sounds confident, the user trusts it without checking, and nobody complains or edits the text. If you only watch telemetry, you end up fixing small user annoyances while staying completely blind to catastrophic errors that slipped through unnoticed.
- The Practical Alternative: Never rely on telemetry alone. Balance live logs with three proactive safeguards:
- Brainstorm worst-case disasters before launch: Don't wait for users to discover your worst bugs in production. List the catastrophic mistakes on day one (unauthorized refunds, leaking private data, wrong medical advice) and write hard automated tests to block them before launch.
- Have real experts audit "happy" sessions: The most dangerous sessions are the ones where users made zero edits and gave a thumbs up. Have a real specialist (an accountant, attorney, or clinician) inspect a regular sample of "successful" runs specifically hunting for confident, plausible lies.
- Take critical math and policy rules away from the AI: Never let a probabilistic language model calculate financial totals, apply tax rules, or make legal cutoff decisions. Keep those calculations in regular, deterministic software code that cannot hallucinate.
2. Under what circumstances would this fail?
Even the most sophisticated telemetry pipeline collapses under three enterprise conditions:
- 1. The Air-Gapped Knowledge Workflow:
- The Failure: Users copy generated text, paste it into private desktop tools (Excel, Word, Zoom), and complete the work offline.
- The Implication: Telemetry reports a 100% copy rate and zero friction, giving product teams false confidence while customers silently perform hours of manual rework offline.
- The Countermeasure: Pull downstream actions into the application (native document editors, direct ERP/CRM integrations), or conduct monthly observational user shadowing sessions to inspect offline workflows directly.
- 2. Long-Horizon Reconciliation Lag:
- The Failure: Real-world ground truth takes 6 to 18 months to materialize (e.g., commercial loan defaults, court rulings, venture investments).
- The Implication: The feedback loop is dead on arrival; telemetry cannot guide active sprints or model upgrades if verification arrives a year after deployment.
- The Countermeasure: Evaluate immediate procedural milestone proxies (e.g., compliance checklists, regulatory ratio checks) and benchmark candidate models against historical archives where outcomes are already settled.
- 3. Collaborative Attribution Soup:
- The Failure: Multiple human operators edit, inject data, and rewrite drafts across days before taking action.
- The Implication: Causal attribution collapses; teams cannot prove whether downstream success or failure was caused by the AI or the human edits.
- The Countermeasure: Evaluate bounded micro-tasks (extraction, table conversion) at the point of generation rather than evaluating the final collaborative end product.
3. What would a skeptical customer, client, or colleague object to?
- "You are proposing to inspect our employees' prompts, corporate documents, and workflow behavior. Who owns that telemetry, and how do we prevent trade secrets from leaking into your shared evaluation suites?"
- The Resolution: Enterprise buyers rightly reject unconstrained trace mining. The system requires an explicit Telemetry Data Contract enforcing bounded capture, cryptographic tenant isolation, and synthetic reconstruction so that raw customer text never enters shared test suites and only abstract failure topologies are retained.
4. Which alternative deserves more consideration?
- Pre-Deployment Hazard Analysis & Credentialed Expert Panels: Instead of relying on production traffic to reveal failure modes reactively, invest heavily in pre-deployment failure mode and effects analysis (FMEA), formal verification gates, and continuous panels of accredited domain experts (clinicians, attorneys, CPAs). In high-liability environments, discovery must be hazard-led before it is telemetry-led.
5. What am I assuming that may not be true?
- Assumption 1: Downstream workflow actions are legally and technically observable in-app. Where users copy-paste out of the tool into uninstrumented environments, observability collapses.
- Assumption 2: Users recognize errors and attempt error correction. In practice, overworked employees frequently accept authoritative, plausible hallucinations without reading them.
- Assumption 3: Telemetry volume is sufficient to distinguish signal from noise. In low-volume enterprise workflows (<500 sessions/week), behavioral friction clustering lacks statistical significance.
Next in the Series
Once you have identified a high-priority failure hypothesis, the critical question becomes: How do you triage and isolate the defect without creating evaluation debt?
In Part 2: Architectural Isolation, Prioritization, and Boundary Mapping, we explore:
- The Failure Diagnosis Matrix: why you must strip math and state rules into deterministic code before writing evals.
- The qualitative Evaluation Prioritization Rubric and auditable Severity Tiers 1–5.
- Mapping one-off incidents into multi-case boundary test matrices.
- Codifying findings into the standardized PM Eval Spec Sheet.
And in Part 3: Tiered CI/CD Portfolios, Anti-Gaming, and the Minimum Viable Loop, we examine how to run the multi-tier release harness, manage expert audit bottlenecks, prevent telemetry gaming, and execute the 3-move Minimum Viable Flywheel.
One-Line Synthesis
Production telemetry functions as a behavioral hypothesis engine: its value materializes only when filtered through workflow feasibility, constrained by data contracts, and counterbalanced against pre-deployment hazard modeling.
Frequently Asked Questions
Why is production telemetry an insufficient discovery engine on its own?
Telemetry only captures observable friction within instrumented software. In high-consequence enterprise workflows, catastrophic failures are frequently silent: users believe plausible hallucinations without re-prompting or editing. Additionally, critical business outcomes often occur offline in meetings, emails, or spreadsheets. Production AI requires a Plural Evidence Architecture combining telemetry-led discovery with hazard-led prevention and outcome-led audit calibration.
What is the Observability Feasibility Gate?
Before treating telemetry as a primary discovery vector, teams must evaluate five feasibility dimensions: workflow capture (can the product observe downstream actions legally?), outcome lag (does ground truth arrive in hours or months?), attribution (can AI contribution be isolated?), auditability (can experts reconstruct the defect?), and privacy viability (can traces be safely retained and inspected?).
What is a Telemetry Data Contract?
Enterprise customers will not permit unconstrained trace mining. A Telemetry Data Contract specifies exactly what payload fields are captured, what PII/credentials are redacted prior to persistence, tenant isolation boundaries, retention windows, and whether synthetic reconstruction must replace raw customer artifacts before expert review.
How does synthetic reconstruction resolve the tension between trace reconstructability and privacy?
Teams capture structural execution metadata (failure topology, branching paths, schema slots) while discarding raw customer text. Domain experts identify the abstract reasoning failure, and generative models produce plausible synthetic entities that replicate the structural defect without retaining customer PII or proprietary trade secrets.
What separates prompt thrashing from normal workflow exploration?
A user asking follow-up questions with additive instructions is satisfied and advancing their workflow. Prompt thrashing occurs when follow-up submissions exhibit high semantic overlap paired with restrictive, negative qualifiers ('no', 'stop', 'do not', 'I already told you'), indicating user error correction.
Subscribe to the Architecture of Proof Dispatch
Rigorous, decision-forcing systems engineering and AI governance monographs for technical leaders. Delivered periodically, zero spam.